
THREAD1-gdp measured against m2 is the velocity of money. This measures inflation or deflation, velocity spikes when gdp grow faster than m2, people run off money because rising prices, we are going to apply this comparison against other asset (btc, gold,dow j.) instead of GDP 

2-as u can see in the previous chart since 00´s the veloc. wont stop from falling, this is deflation in GDP in the real economy, thats because m2 rise faster than gdp can grow, so where is all that money going? will see
3-two charts gov.debt and m2, you can calculate the velocity of debt as in the past graph you got the velocity of money in the economy. see the las 10 years a sideways patern and stop from rising, means that debt colocation is less against m2 printing machine.
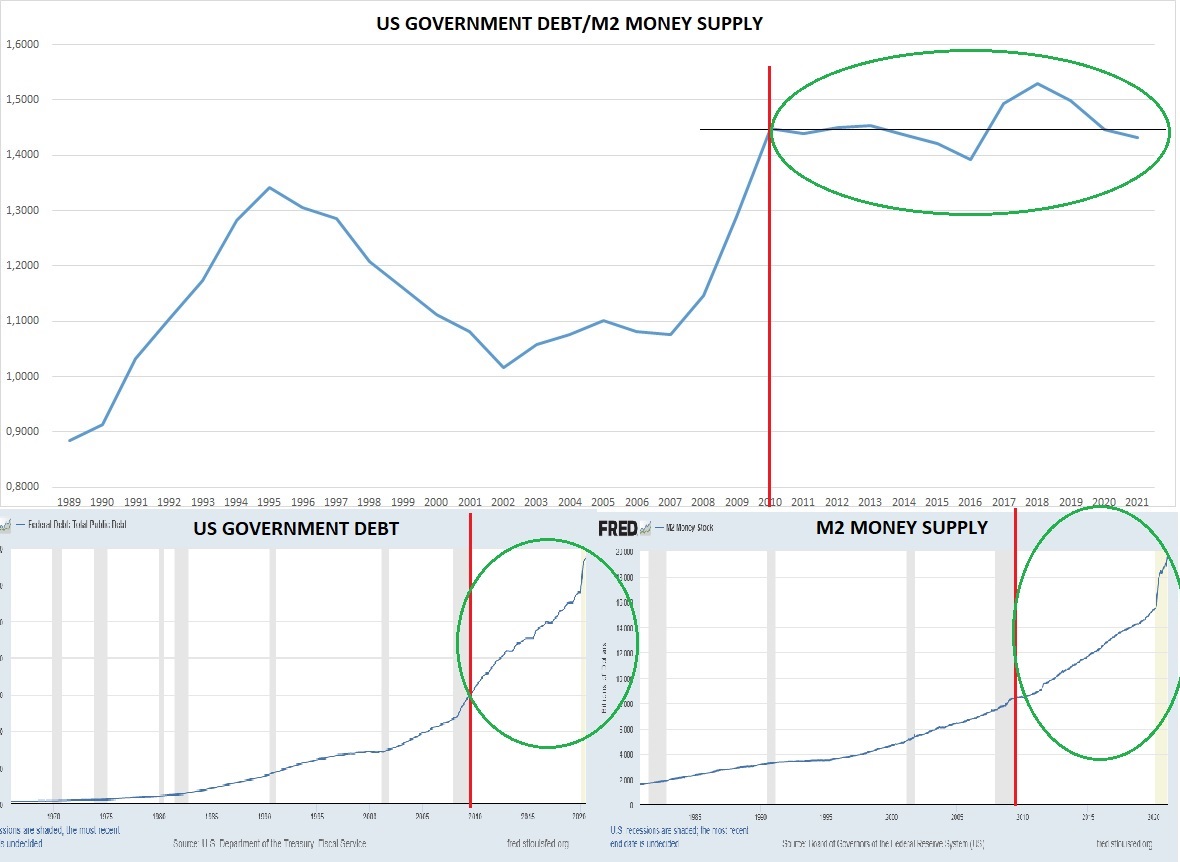
4-the sideways pattern is a be carefull sign, if US cant borrow debt in a bigger proportion than printing this chart will go downards meaning that less people lend to US and prints more each time, case of ARGENTINA and other inflationary nations
5-Here we divide Dow jones value against M2, we will call it Velocity of the DOW, see how the same sideways pattern repeat after 08 crash, This means that is not in a inflationary trend nor a deflationary trend but in terms of dollars dow jones´s value went up.

6-that´s bcause rise of the dow against m2 is almost enough to make a sideways trendline in this velocity, so the stocks arent more expensive than12 ys. ago, m2 rise xxx usd and the dow rise in the same proportion, telling us the stocks arent inflating just absorbing the new cash
7-the best at the end, velocity of Bitcoin against Velocity of gold, keeping with the same formula will see that the only asset is inflating or apreciating against all this printing is bitcoin, gold suffer trying to rise more against m2 thats why trends sideways

8-conclusion: we have real economy falling down in deflation, debt in a sideways trend showing is geting harder to refinance and get new lenders, dow and gold sideways just enough good to only keep purchasing power, bitcoin a beast eating all the apreciation
9-final question, where all this bonds that are being sold, will be allocated? too much money to digest
• • •
Missing some Tweet in this thread? You can try to
force a refresh


