Our daily update is published. States reported 1.2M tests, 68k cases, 55,058 currently hospitalized, and 2,196 deaths. Alt-Text: 4 bar charts showing daily COVID-19 metrics. State
Nationally, hospitalizations are still falling, albeit at a slower pace in recent days. Alt-Text: bar chart with zoom overlay showing COVID-19 hospi
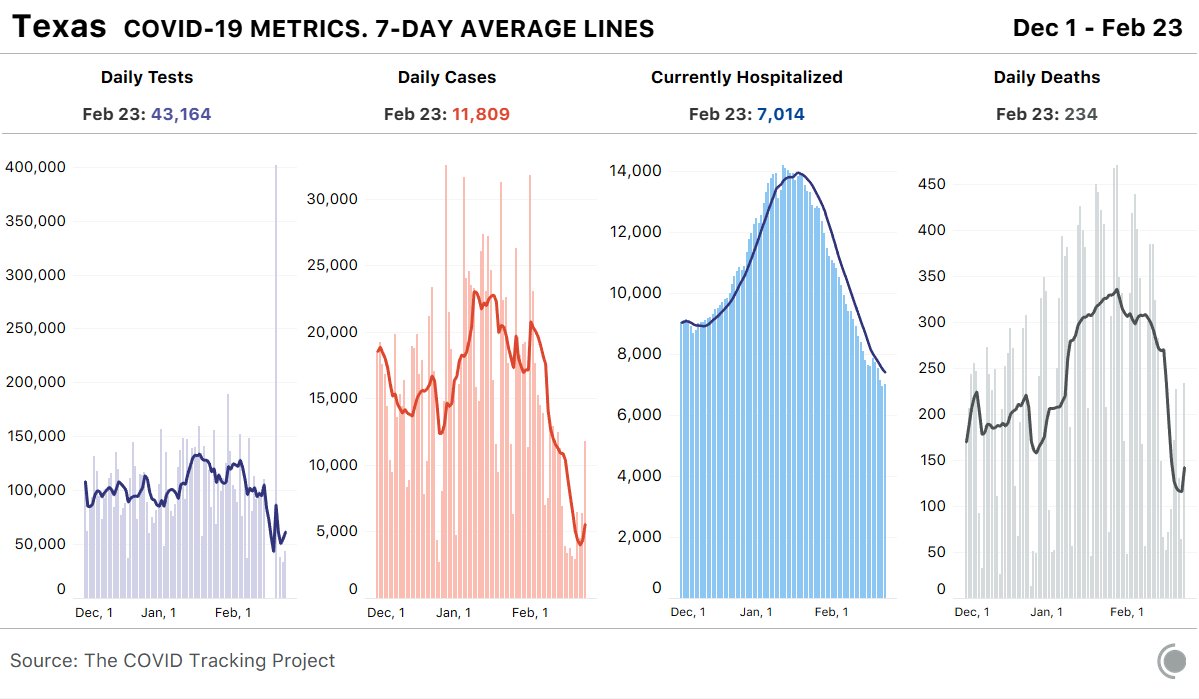
Texas reported relatively high numbers for new cases and deaths today, likely due in part to backlog clearing following the recent winter storms. Alt-Text: 4 bar charts showing COVID-19 metrics over time fo
In Virginia, the processing of death certificates related to surges in post-holiday cases is resulting in high reported deaths over the past 4 days. Alt-Text: Virginia COVID-19 deaths over time (daily bar char

• • •

Missing some Tweet in this thread? You can try to force a refresh
 

Keep Current with The COVID Tracking Project

The COVID Tracking Project Profile picture

Stay in touch and get notified when new unrolls are available from this author!

Read all threads

This Thread may be Removed Anytime!

PDF

Twitter may remove this content at anytime! Save it as PDF for later use!

Try unrolling a thread yourself!

how to unroll video
  1. Follow @ThreadReaderApp to mention us!

  2. From a Twitter thread mention us with a keyword "unroll"
@threadreaderapp unroll

Practice here first or read more on our help page!

More from @COVID19Tracking

24 Feb
As we wind down data compilation, we want to help everyone understand how to find and use federal COVID-19 numbers. Today, we’re going over CDC case data. covidtracking.com/analysis-updat…
The @CDCgov publishes aggregate and line-level case data. Aggregate data includes total numbers of cases by jurisdiction and totals for confirmed and probable cases where available. Line-level includes a de-identified line for each case with detailed demographic data.
The CDC aggregate case data is extremely similar to the state-reported data we have been capturing. US cartogram showing which ...
Read 5 tweets
22 Feb
Since vaccinations began in late 2020, we expected them to show up first in our Long-Term-Care data. And it finally has. We’ve seen signs over the last few weeks that vaccines, along with a broader decrease in community spread, are having a rapid, positive impact in LTCs. Alt-text: 3 bar charts showing weekly COVID-19 impacts in LT
Deaths in LTCs have fallen drastically. After adjusting for backlogs, our weekly deaths figure has declined ~70% since Jan 7. LTCs previously accounted for at least 35% of total deaths, yet last week their share was cut to 16%, the lowest ever recorded in our dataset. Alt-Text: bar chart showing weekly deaths in long-term-care
Since their peak just before Christmas, new cases in long-term-care facilities have fallen by 87%, with the bulk of the drop occurring in the last three weeks. New cases last week were the lowest ever recorded in our dataset, which dates back to May 28. Alt-Text: Cases in long-term-care facilities by week. Cases
Read 6 tweets
21 Feb
Our daily update is published. States reported 1.3M tests, 72k cases, 58,222 people currently hospitalized, and 2,074 deaths. 4 bar charts showing key COVID-19 metrics for the US over ti
Today's COVID-19 case count is the lowest on a Saturday since Oct 17. Chart showing daily COVID-19 cases on a Saturday since March
Hospitalizations continue to drop. Today's total is the lowest since Nov 8. Chart showing hospitalizations due to COVID-19 going back to
Read 5 tweets
20 Feb
Our daily update is published. States reported 1.9M tests, 75k cases, 59,882 people currently hospitalized, and 2,477 deaths. 4 bar charts showing key COVID-19 metrics for the US over ti
COVID-19 hospitalizations are now under 60k for the first time since November 9, bringing us back down to the peak levels of hospitalizations we saw in the spring and summer surges. A chart showing hospitalizations due to COVID-19 going back
Hospitalizations are still dropping quickly in every region of the country. 4 charts showing hospitalizations due to COVID-19 for each U
Read 5 tweets
19 Feb
Our daily update is published. States reported 1.4M tests, 67k cases, 62,300 currently hospitalized, and 2,616 deaths. Alt-Text: 4 bar charts with key COVID-19 for the US. States
7-day average deaths fell below 2,000 for the first time since Dec 4. This deaths average was above 3,000 as recently as Feb 6. Alt-Text: bar chart showing daily deaths from COVID-19 in th
Data users may notice differences in 7-day average deaths between our social posts and website. We have removed major death backlogs reported by OH and IN in these daily social posts to clarify the trend. Those backlogs remain in our cumulative numbers.
Read 4 tweets
18 Feb
Our weekly update is published. All major indicators of COVID-19 transmission in the US continue to fall rapidly. Deaths are down 20% from last week. covidtracking.com/analysis-updat… 4 bar charts showing weekly COVID-19 metrics for the US. Tes
Although states are still reporting large numbers of cases, many parts of the country show absolute levels much closer to what we saw before the most recent surge accelerated nationally in October. 2 cartograms of the US, both showing COVID-19 cases by state
Every region and sub-region of the US now shows substantial declines in the number of hospitalized COVID-19 patients. 9 area charts showing currently hospitalized by US sub-regio
Read 6 tweets

Did Thread Reader help you today?

Support us! We are indie developers!


This site is made by just two indie developers on a laptop doing marketing, support and development! Read more about the story.

Become a Premium Member ($3/month or $30/year) and get exclusive features!

Become Premium

Too expensive? Make a small donation by buying us coffee ($5) or help with server cost ($10)

Donate via Paypal Become our Patreon

Thank you for your support!

Follow Us on Twitter!