We (@Rahmstorf et al) reached that conclusion in a 2015 @NatureClimate study (nature.com/articles/nclim…). It featured a reconstruction over the past 1000 years of the sub-polar "cold blob" (below) that is indicative of an AMOC slowdown.
These findings suggest that the slowdown in the AMOC is happening SOONER than expected, probably because Greenland melt & freshwater runoff to North Atlantic is happening sooner than expected. See this discussion by @Rahmstorf: realclimate.org/index.php/arch…
This is the "Day After Tomorrow" scenario. The good news is that them movie is a caricature of the science. We won't get another Ice Age. But we could see adverse impacts on fish populations in North Atlantic and accelerated sea level rise along parts of the U.S. east coast.
This is all a reminder that uncertainty isn't our friend. In many respects, as we learn more, we're finding that climate change impacts are playing out faster and bigger than we predicted.
It sucks to be right sometimes. That applies to the 'Hockey Stick" temperature reconstruction (medium.com/@USC/the-hocke…). And now, to the accelerated slowdown of the "conveyor belt" ocean circulation pattern.
• • •
Missing some Tweet in this thread? You can try to
force a refresh
There's a lot of "friendly fire" in the #NewClimateWar (publicaffairsbooks.com/titles/michael…). Despite having some of the best climate journalists on staff, @NYTimes editorial decisions have often played into the tactics of climate inactivists (presumably unwittingly). Some examples (thread):
The @NYTimes engaging in "deflection" (i.e. it's all about individual lifestyle change rather than systemic change)
The @NYTimes providing editorial page space for a low blow attack on youth climate advocate @GretaThunberg
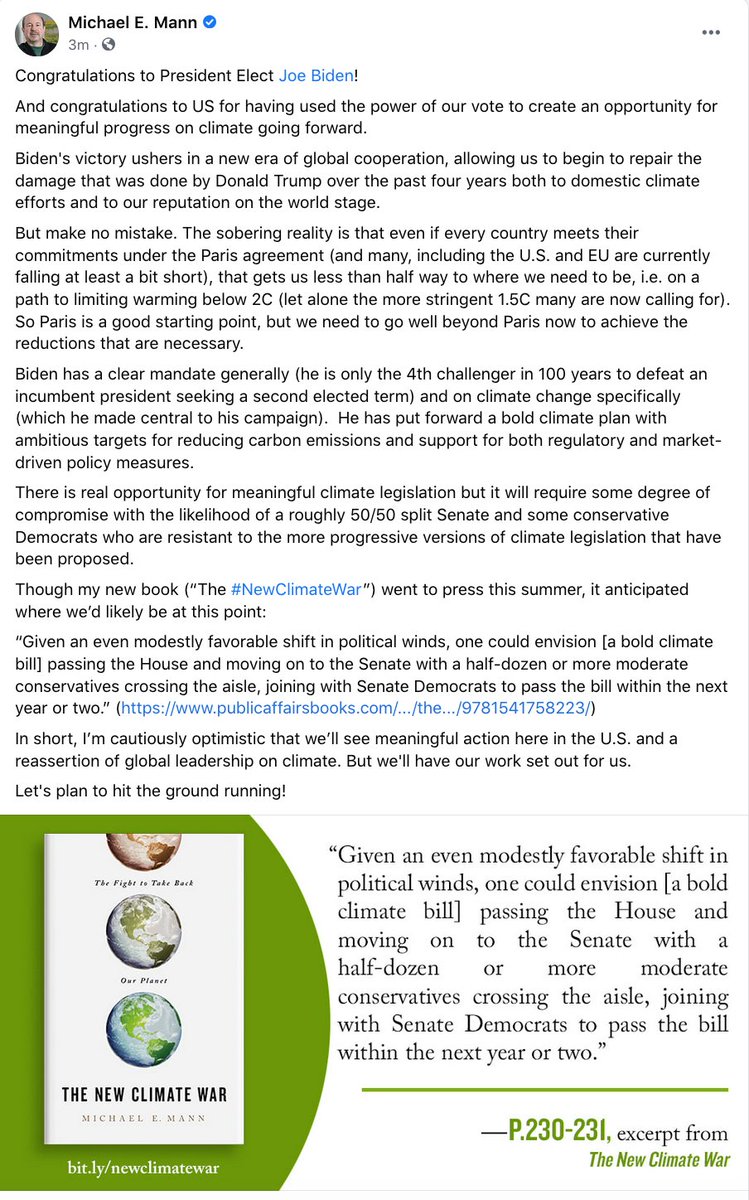
Congratulations #PresidentBiden!
Now let's get to work.
We must reassert the climate leadership that was lost under Trump.
A lot of us stand ready to help!
Here's my full statement below.
Let's hit the ground running in January! 🙂 #NewClimateWar facebook.com/MichaelMannSci…
Congratulations to President Elect @JoeBiden!
And congratulations to US for having used the power of our vote to create an opportunity for meaningful progress on climate going forward (thread)
Biden's victory ushers in a new era of global cooperation, allowing us to begin to repair the damage that was done by Donald Trump over the past four years both to domestic climate efforts and to our reputation on the world stage.
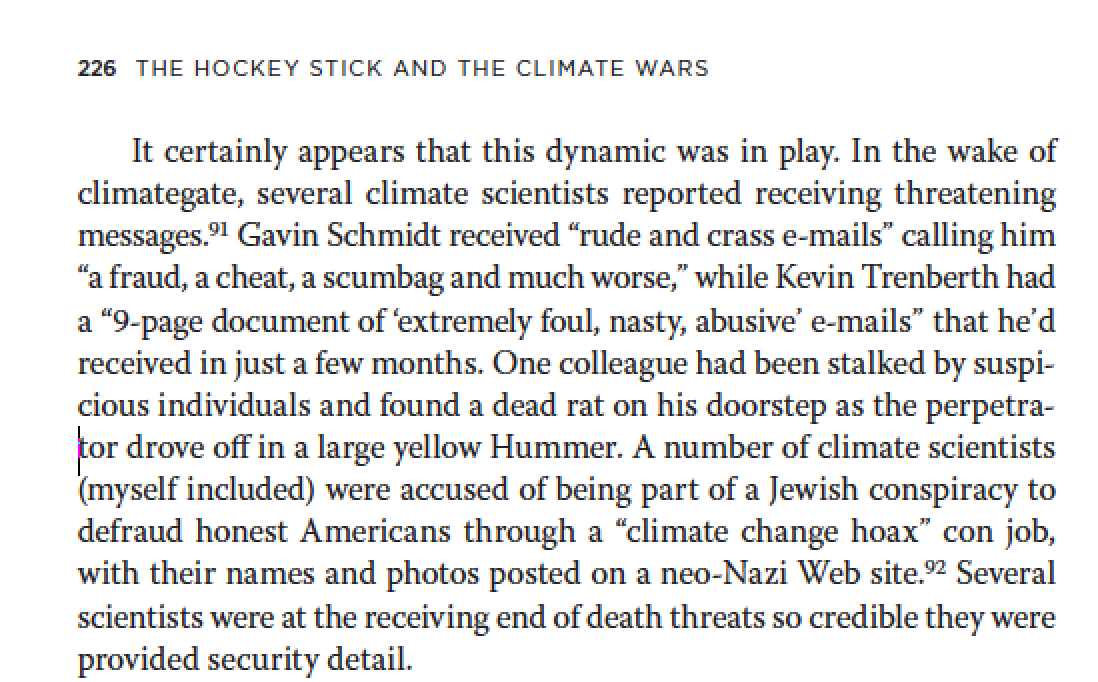
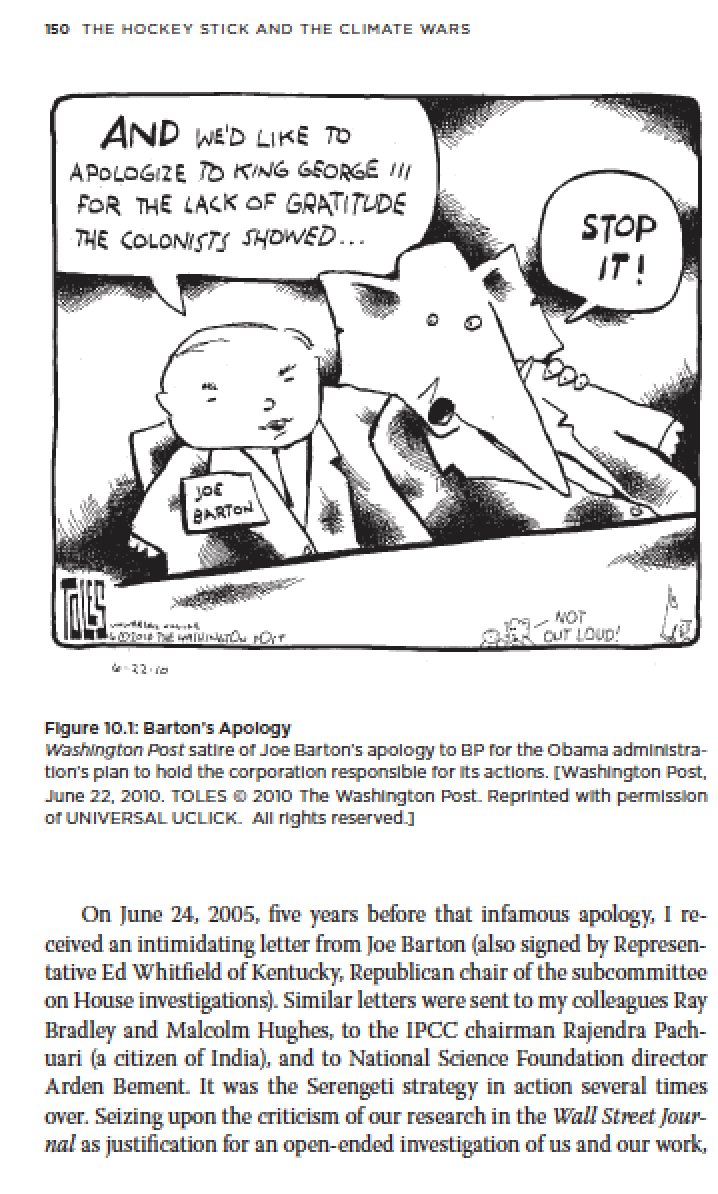
Short thread on what it was like to be a climate scientist a decade ago for some, courtesy of excerpts from "The Hockey Climate Wars" (amazon.com/Hockey-Stick-C…) 1. Being targeted for assault by national white supremacist groups for being part of a purported Jewish climate cabal.
2. Actionable death threats against you and your family. FBI testing your office for anthrax after receipt of a powder-containing envelope.
3. Investigations by Congressional Republican Committee Chairs aimed at intimidating you and discrediting you and your research.
), Pielke’s claims are based on (1) a dubious normalization procedure that divides damages by global domestic product (GDP), a quantity that increases dramatically over time and...
@skepticscience (2) use of a simple least squares trend which is problematic for data such as these with a skew distribution. These choices suppress damage trends
"It's not an uncommon view among scientists that we potentially compromise our objectivity if we choose to wade into policy matters or societal implications of our work. And it would be problematic if our views on policy somehow influenced the way we went about doing our science"
"But there is nothing inappropriate at all about drawing on our scientific knowledge to speak out about the very real implications of our research."
"If scientists choose not to engage in the public debate, we leave a vacuum that will be filled by those whose agenda is one of short-term self-interest..."
Much is being made of a graph depicting changes in methane concentrations at Barrow Alaska and a recent supposed spike over the last year.
Let's catch our breath for a moment and put this in proper scientific context. 1/n (thread)
The 2019 measurements are consistent with the trend over the past decade. Outliers (i.e. isolated data points that lie well above the average) are seen throughout the record. Do not over-interpret them.
2/n
We see in the above graph a slowdown during the 1990s. This is well studied and understood. It has to do with a temporary reduction in wetlands methane emissions during that time: sciencedaily.com/releases/2006/…
3/n