What could happen next with novel variants like P.1 in the UK? There are four possible scenarios. A short thread with some thoughts... 1/
Scenario A: R<1 for both dominant B.1.1.7 variant and other variants of concern like P.1. This is likely situation we're currently in, but staying there is conditional on slow relaxation of control & substantial reduction in infectiousness via vaccines. 2/
However, even if R<1 for a novel variant, there could still be a lot of cases to come before outbreak ends, depending on value of R: 3/
Scenario B: R>1 for B.1.1.7 variant but R<1 for variants of concern identified in Brazil/South Africa etc. (let's call these nVOCs). This could happen if measures relaxed overall, but aggressive targeted containment prevents imported nCOVs taking hold. 4/
Of course, this doesn't account for novel variants of concern that emerge domestically but aren't immediately detected, which could well happen if transmission ongoing in a partially vaccinated population: 5/
Scenario C: R<1 for B.1.1.7 but R>1 for nVOCs. At the moment, the low reproduction number for B.1.1.7 depends both on accumulated immunity and control measures. So if nVOCs can escape immunity to some extent and take hold, they could grow even if B.1.1.7 slowly declining. 6/
More on the point at which this cross-over could occur: 7/
Scenario D: R>1 for B.1.1.7 and R>1 for nVOCs. If UK reopening follows the provisional dates not data, then could end up in this scenario, and outcome would depend on how well vaccines work against nVOCs... 8/
Vaccines are still likely to have some effect against the currently identified variants (e.g. helping to prevent more severe outcomes) but the exact impact is currently uncertain: 9/9

• • •

Missing some Tweet in this thread? You can try to force a refresh
 

Keep Current with Adam Kucharski

Adam Kucharski Profile picture

Stay in touch and get notified when new unrolls are available from this author!

Read all threads

This Thread may be Removed Anytime!

PDF

Twitter may remove this content at anytime! Save it as PDF for later use!

Try unrolling a thread yourself!

how to unroll video
  1. Follow @ThreadReaderApp to mention us!

  2. From a Twitter thread mention us with a keyword "unroll"
@threadreaderapp unroll

Practice here first or read more on our help page!

More from @AdamJKucharski

14 Feb
I sometimes see people making the mistaken assumption that once a group that make up X% of COVID hospitalisations/deaths are vaccinated, it will reduce hospitalisations/deaths by the same %, even if control measures are lifted. There are two main problems with this... 1/
First, there is a trade off between level of infection in the population and risk reduction through vaccination. Disease outcomes (e.g. hospitalisations/deaths) can broken down into the following: new infections x average-risk-per-infection... 2/
If we remove 50% of the hospitalisation risk within a population through vaccination, for example, but have a large increase in level of infection, it could mean no reduction (or even an increase) in overall hospitalisations... 3/
Read 5 tweets
11 Feb
If you want to come up with a prior* for the possible long-term dynamics of SARS-CoV-2, there are two recent papers that I think are useful...

(*Prior: en.wikipedia.org/wiki/Prior_pro…) 1/
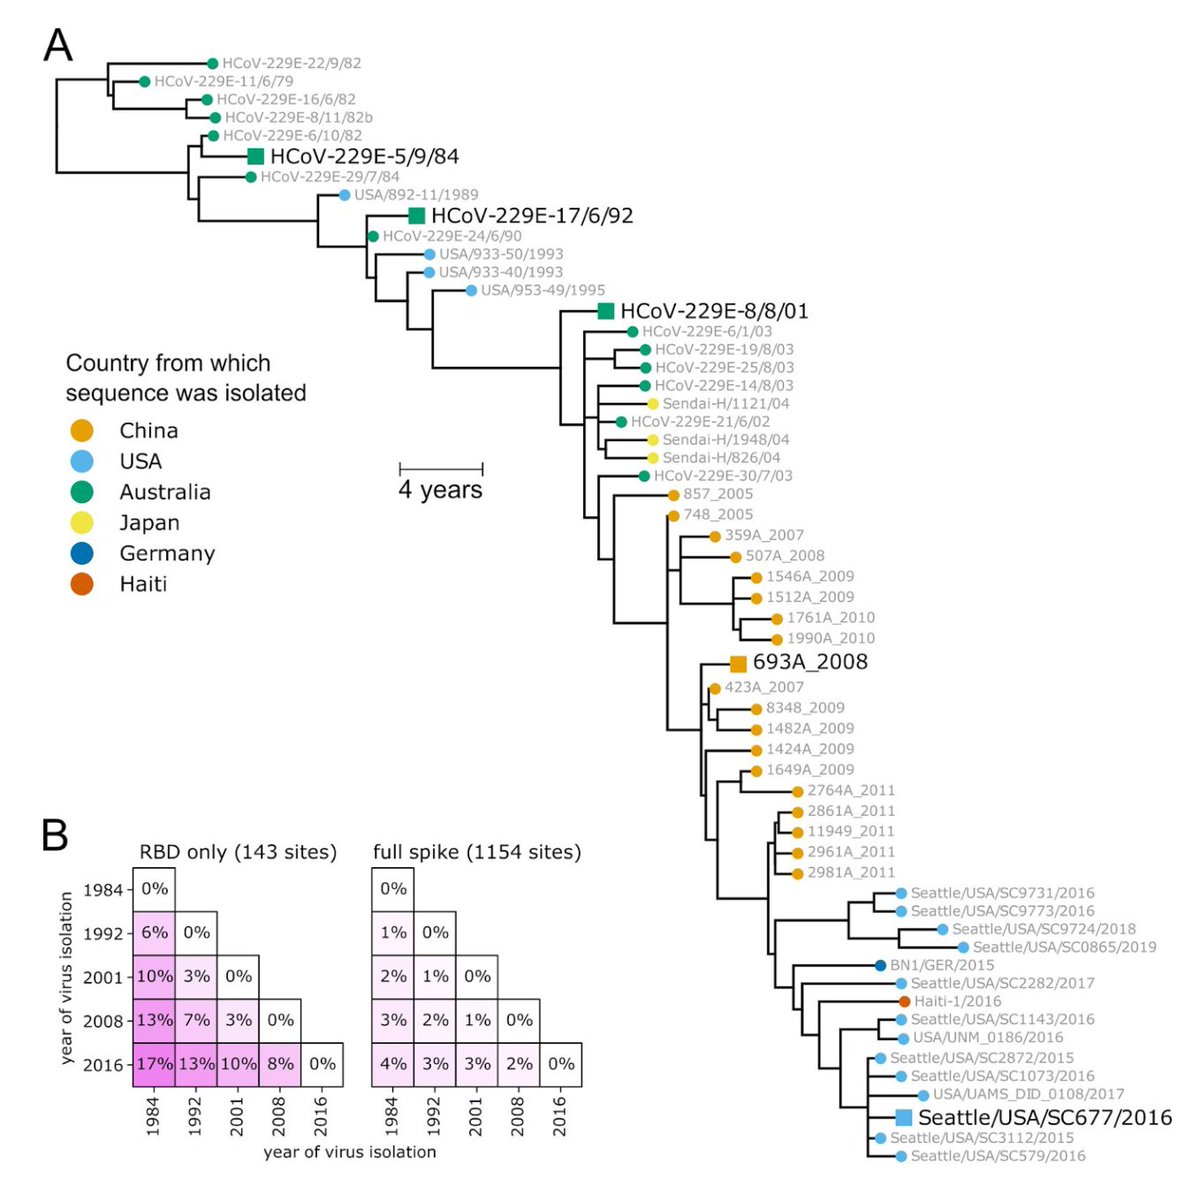
First, this pre-print by @eguia_rachel & @jbloom_lab showing that the seasonal coronavirus 229E can undergo 'antigenic drift' to partially escape immunity over time. biorxiv.org/content/10.110… 2/
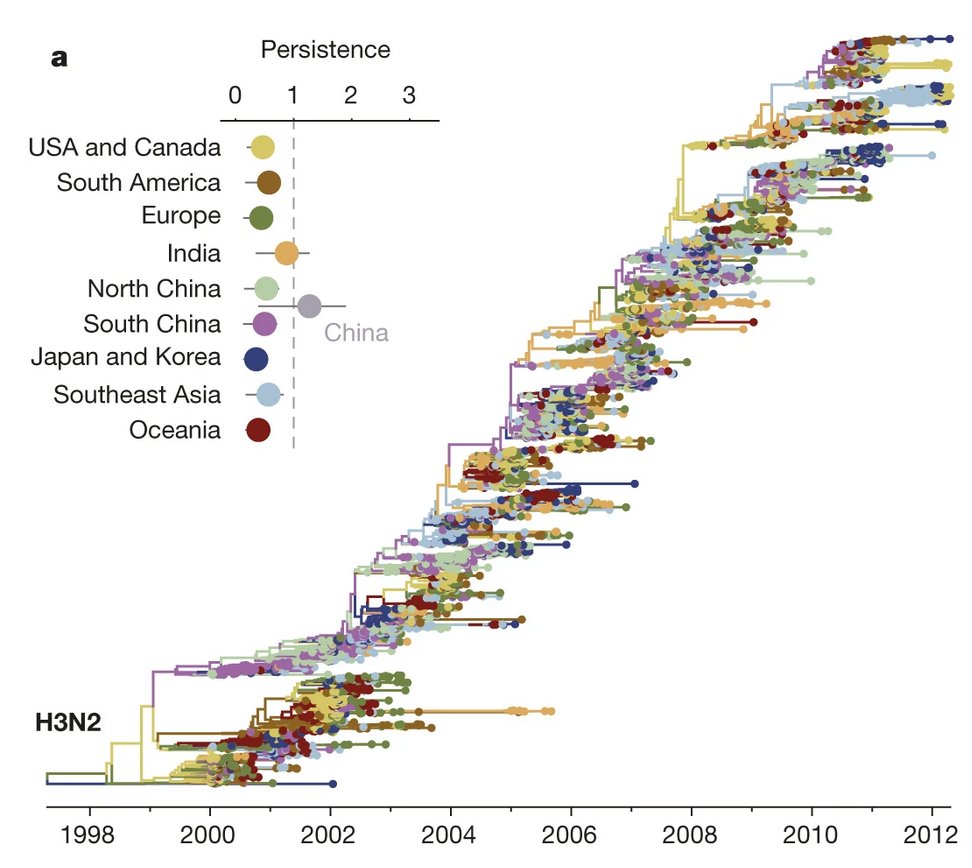
As with influenza, they find a 'ladder-like' phylogenetic tree, suggesting that new variants emerge, become dominant, then are gradually replaced by subsequent new variants. (Influenza A/H3N2 below right from: nature.com/articles/natur…) 3/
Read 7 tweets
9 Feb
Suppose we have a SARS-CoV-2 variant that is inherently more transmissible, and another that is more likely to reinfect people who've previously developed immunity. Which will spread more easily? A thread... 1/
We know we can measure transmission using R, but it helps to break R down into four components - duration, opportunities, transmission probability and susceptibility - or 'DOTS' for short. As below describes, R = D x O x T x S. 2/

For example, if have a variant (call it V1) that is inherently better at transmitting during social interactions, it would mean an increase in 'T'. If it was 50% more likely to transmit per contact, we'd replace 'T' with '1.5 x T'... 3/
Read 8 tweets
8 Feb
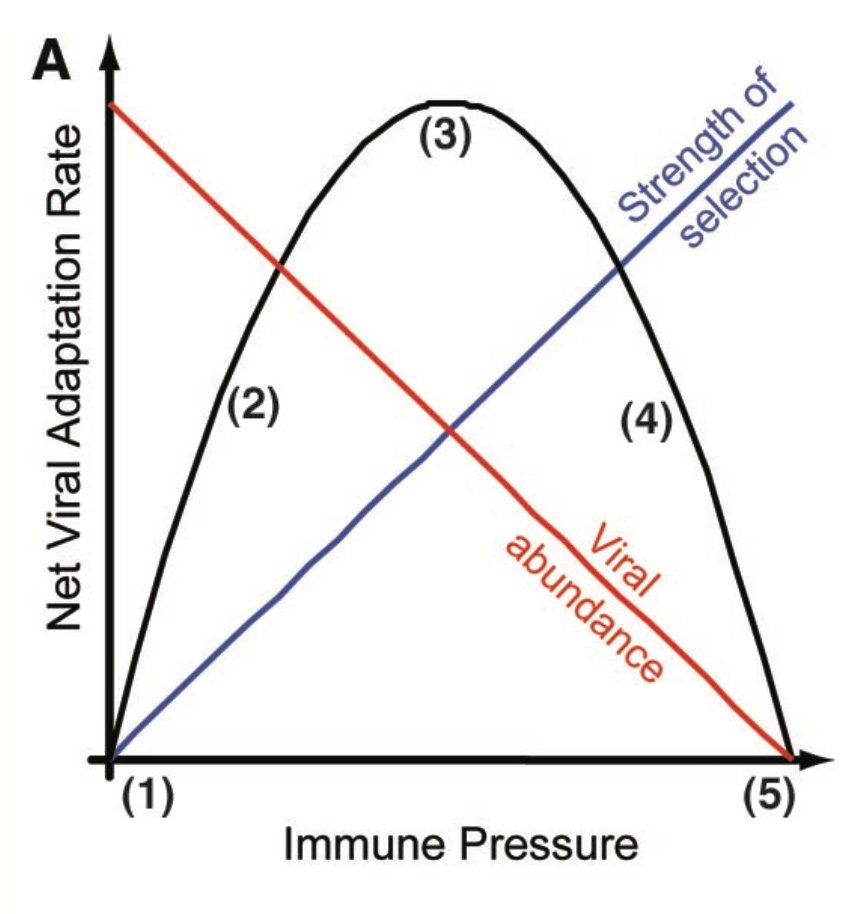
Over the coming months, many countries will move from the left to the right in this plot... (from: science.sciencemag.org/content/303/56…) 1/
Specifically, many will move from high COVID-19 prevalence but little prior immunity (& hence little advantage for variants that can escape this immunity to some extent), to lower prevalence and higher immunity (& hence more advantage for variants that can escape immunity) 2/
As you can see, the highest rate of adaptation (labelled '3' in the plot below) occurs during the intermediate phase, when there is still enough transmission to generate new variants as well as enough immunity to create an advantage for variants than can evade this immunity. 3/
Read 5 tweets
4 Feb
I've noticed people sometimes use 'herd immunity' to mean 'pathogen fades to zero and stays there' rather than the technical definition (i.e. R drops below 1 because of accumulated immunity, without NPIs). Why is the distinction important? 1/

If we're talking about 'fades to zero', we're really talking about elimination or eradication as a result of accumulated immunity. So has this ever occurred in the absence of a vaccine? 2/
There are no examples of eradication (i.e. no infections globally) as a result of accumulated natural immunity, rather than from a vaccine-induced immunity or NPIs (like smallpox). 3/
Read 6 tweets
29 Jan
These “COVID rankings” are being widely shared, but I think it illustrates why it’s unhelpful to try and precisely score countries in this way at a specific point mid-pandemic (first 36 weeks in this case)... interactives.lowyinstitute.org/features/covid… 1/
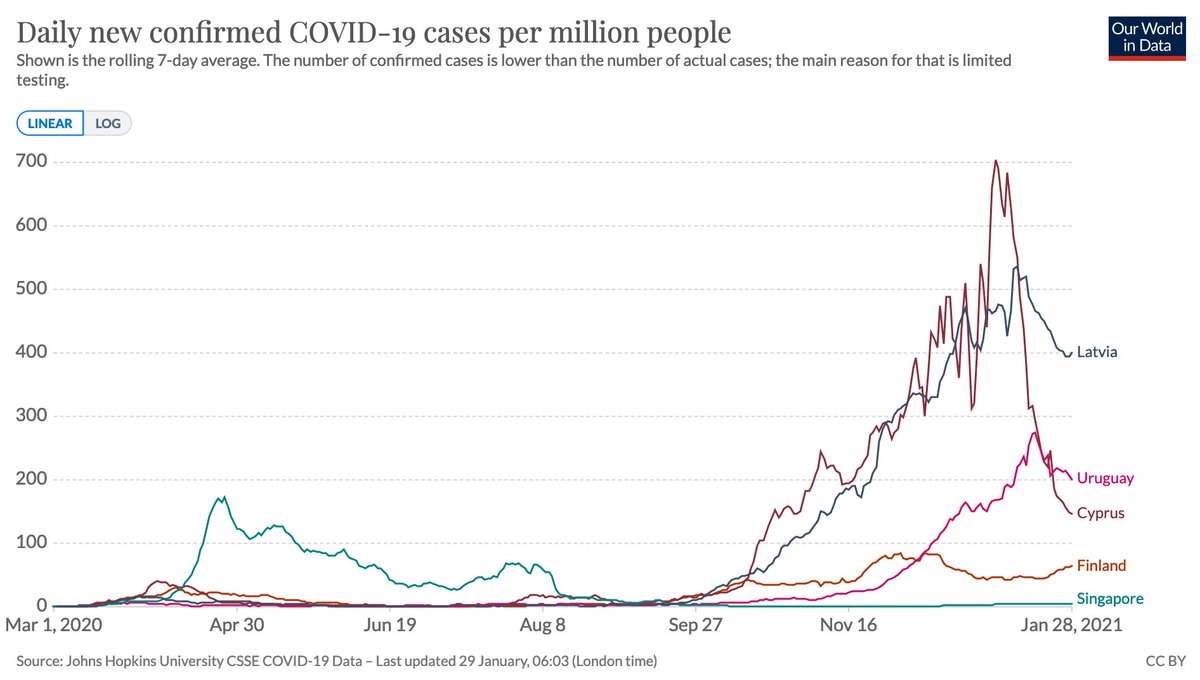
The study uses cases, deaths and testing data to rank countries. But compare the case curves of Cyprus (ranked 5th), Latvia (9th), Uruguay (12th), Singapore (13th) and Finland (17th). Things have changed a lot since first half of 2020: 2/
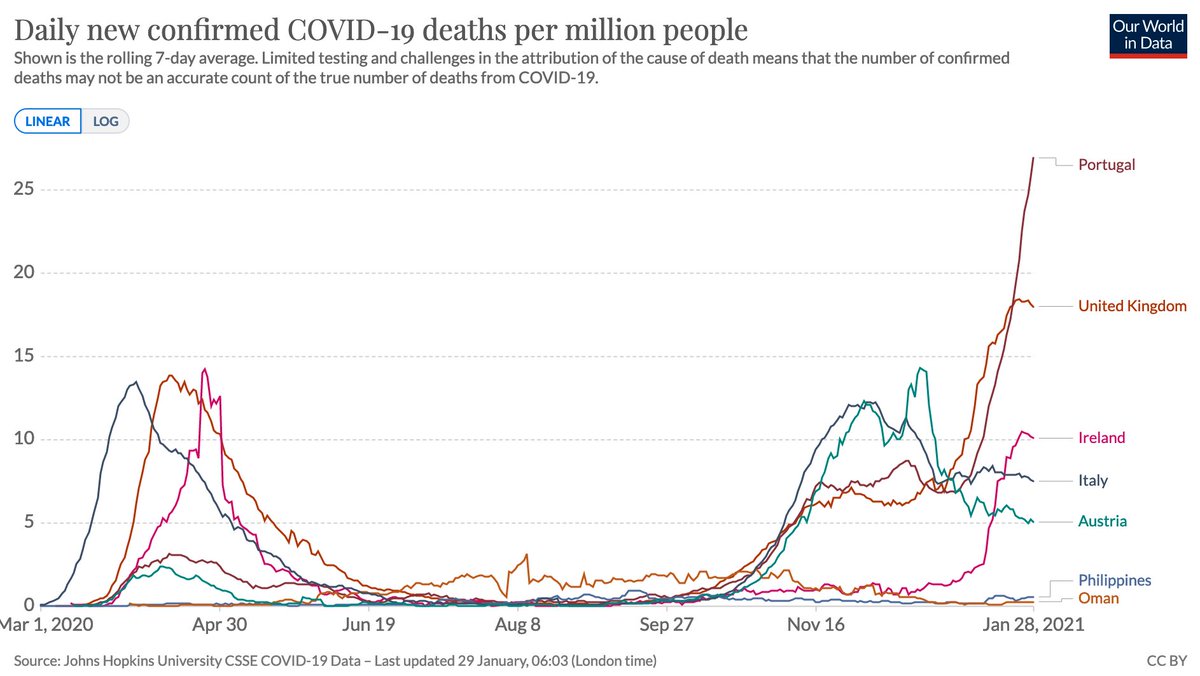
Or look at Philippines (79th) and Oman (91st) - if we’re judging on COVID metrics alone (as the ranking does), is it really plausible to say they’ve had worse epidemic than Austria (42nd), Ireland (43rd), Portugal (63rd) and UK (66th)? 3/
Read 4 tweets

Did Thread Reader help you today?

Support us! We are indie developers!


This site is made by just two indie developers on a laptop doing marketing, support and development! Read more about the story.

Become a Premium Member ($3/month or $30/year) and get exclusive features!

Become Premium

Too expensive? Make a small donation by buying us coffee ($5) or help with server cost ($10)

Donate via Paypal Become our Patreon

Thank you for your support!

Follow Us on Twitter!