1/ @APDillon_ @Chad_Adams @PeteKaliner @JohnLockeNC @jonpsanders NC SC-2 Trends through 2/2/21 including current data on graphs to show how things are trending in real time. Discussing thru 2/2 since NCDHHS consistently modifies their dashboard (drives incidence down).
2/ Overall incidence has ⬆️ for the 12th wk to 8.55% (⬆️ 0.08%). Overall incidence has never been at 5% since testing began; no statistically significant change since the mask mandate. Image
3/ Daily incid fluctuated b/w 6.87% & 16.5% (reporting inconsistency) over last 14 days. Jan avg daily incid is 12.0% (⬆️ 1.1% compared to Dec, stat sig). Avg daily incid each month:
May: 6.8% Sept: 5.7% Jan: 12.0%
June: 7.6% Oct: 6.4%
July: 8.1% Nov: 7.4%
Aug: 6.9% Dec: 10.9% Image
4/ Avg wkly incid =10.5% (⬇️ 0.51%); last 3 wks =9.64%. After mask mandate, avg wkly incid fluctuated largely despite mask compliance ~90%. Avg wkly incid each month:
May: 6.9% Sept: 5.7% Jan: 12.4%
June: 7.4% Oct: 6.3% Feb: 8.6%
July: 8.1% Nov: 6.9%
Aug: 7.4% Dec: 10.6% Image
5/ 2/2 rolling 14-day incid avg is 10.42%. After mask mandate, rolling 14-day incid has fluctuated significantly despite reported mask compliance ~90%. Rolling 14-day avg each month:
May: 6.7% Sept: 5.9% Jan: 12.4%
June: 7.6% Oct: 6.2%
July: 7.95% Nov: 8%
Aug: 7.3% Dec: 10.21% Image
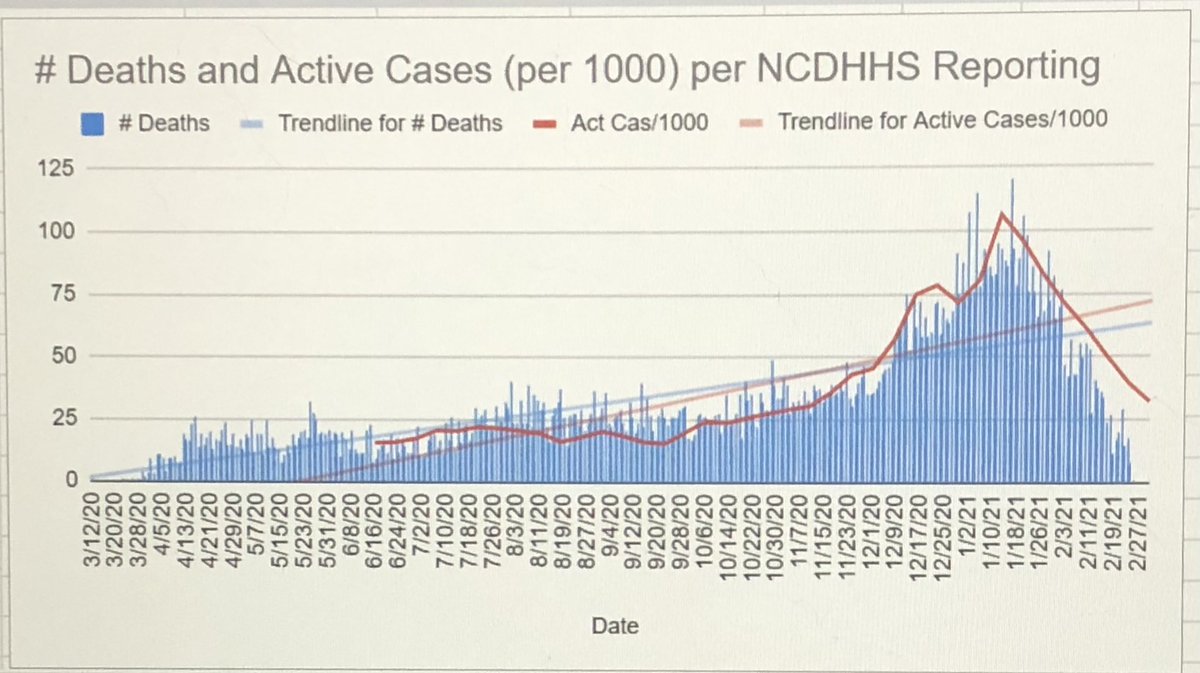
6/ # active cases (70,067) ⬇️d 3rd consecutive wk. Will cont to see ⬇️ cases in Feb (consistent w/flu, PNA) due to seasonality. Avg # new cases/day:
May: 583 Sept: 1352 Jan: 7032
June: 1164 Oct: 2065
July: 1859 Nov: 2996
Aug: 1498 Dec: 5946 ImageImage
7/ # of tests ⬆️ 13.34% compared to Dec. NCDHHS back fills the data, and currently tests can be back filled from 1/30 to present.
May: 281,133 Oct: 1,037,783
June: 348,174 Nov: 1,242,860
July: 714,289 Dec: 1,673,424
Aug: 699,911 Jan: 1,896,598
Sept: 773,697
8/ % recovered =89.5%, % active cases is 9.2%, % deaths (CFR) is 1.37%. Mortality rate ⬆️ to 0.1% (expected). Avg # deaths/day ⬆️ in Jan:
Mar: 0.85 July: 21.1 Nov: 36.0
April: 14.4 Aug: 27.8 Dec: 61.97
May: 18 Sept: 26.5 Jan: 86.2
June: 15.2 Oct: 28.9 Feb: 34.8 ImageImage
9/ 0-17 & 18-24 cohorts, where 15 deaths reported out of 207,719 total cases (CFR = 0.00722%) since 6/15. Conversely, while 15% of NC COVID cases (119,178) are in 65-75+ cohort, 83% of all NC COVID deaths (9,142) are in this cohort; of these 43.23% are in congregate settings.
10/ Hospitalizations ⬇️ by 582 pts to 2723. NOTE: on 3/3/21, vent avail capacity =74%, ICU avail capacity =21.3% at worst & 45% at best, inpatient bed avail capacity =26% at worst & 38% at best. Duke region is most affected w/ICU beds, 11 empty staffed (⬆️ 2). Image
11/ % change in active cases, % change in tests, & incidence ⬇️ 3rd consecutive wk. That’s a very good sign! WCPSS reported 56 cases 1/27-2/2 (25 students/31 staff) while on remote only. Private/charter schools report 43 cases (32 students/11 staff). @Karen4wake
12/ Covid cases per cohort ⬇️‘d for all age groups. Main cohort drivers of Covid transmission are 25-49 yrs, 50-64 yrs, & 18-24 yrs. This wk, there are 4,780 active cases in 50-64 cohort & 9,068 in 25-49 cohort; 6,296 active cases COMBINED in 2-24 cohort. This is in ALL of NC. ImageImage
13/13 Overall and average daily incidence ⬆️. Average weekly/rolling 14-day incidence, active cases, hospitalizations, daily cases, and deaths/day all ⬇️. Hospital capacity is no longer an issue.

• • •

Missing some Tweet in this thread? You can try to force a refresh
 

Keep Current with Tracy Taylor, DPT

Tracy Taylor, DPT Profile picture

Stay in touch and get notified when new unrolls are available from this author!

Read all threads

This Thread may be Removed Anytime!

PDF

Twitter may remove this content at anytime! Save it as PDF for later use!

Try unrolling a thread yourself!

how to unroll video
  1. Follow @ThreadReaderApp to mention us!

  2. From a Twitter thread mention us with a keyword "unroll"
@threadreaderapp unroll

Practice here first or read more on our help page!

More from @DrTracyTaylor

14 Mar
1/ @APDillon_ @PeteKaliner @Chad_Adams NC SC-2 data post for 2/9/21 w/comparison to 2/2/21 in parentheses unless otherwise noted. I’m still playing catch-up; will try to be within 2 week window within a week!
2/ But FIRST, let me preface data w/ this: as of 3/9, there are ~26,484 active Covid cases in ALL of NC. This means 0.252% of NC pop has Covid. Said in a different way, 99.747% of NC population does NOT have Covid; that’s roughly 10.463 MILLION people who don’t have Covid.
3/ Via NCDHHS, on 2/9 there were 802,065 (+) cases (⬆️ 37,837) & 730,454 recovered cases (⬆️ 46,757), 10,894 deaths (⬆️ 359), w/2,297 hospitalized (⬇️ 426). There were 60,717 active cases in NC (⬇️ 9,279). NCDHHS continues to backfill/edit tests on their dashboard back ~1 month
Read 12 tweets
10 Mar
1/ “... and he said that the school had taken legal advice and been told that they needed to be ‘seen’ to be mitigating risk.”

I believe that wholeheartedly.
2/ Ystrdy my kids had issue w/schl staff taking temp. Each time they’ve gone (today is day #5 since 3/13/2020; NOT by choice but b/c GOVERNOR won’t allow back in schl) they’ve had it taken from car, in ~30°-40° F, at wrist by request. 1 time got puzzled look but request was met.
3/ Yesterday was different. We made the wrist request, a teacher said, “I was told to take it at the forehead,” and started to walk toward the car and point the gun at Thing 2’s forehead. I yelled, “NO” and she stopped. She said, “We have to do it at the forehead.”
Read 8 tweets
9 Mar
1/ Cooper presser. Covid metrics. <1000 cases yesterday. Vax “fast and fair.” Huge milestone. Soon we can hug our loved ones w/out fear of severe illness.” (Aside: some of us never stopped/needed you permission to hug our loved ones.) Thanks vax administrators. We got nat’l recog
2/ for being fast/fair. More schls returning to in-person learning. Others pressing to get kids in schls. It’s a priority. (Aside: if it really was a priority, Cooper could mandate Plan A & tells districts to #FigureItOut.) More signs of hope. Positivity rate consistently ~5%.
3/ Hispitalizations ⬇️. But we can’t stop preventative efforts. Until vax widely available, can’t relax. One day soon we can turn corner. (Aside: when will that be, Cooper?!? Give us DATA/TARGET or you’re going out of constitutional authority to keep us closed.) Vax event in
Read 15 tweets
26 Feb
1/ @APDillon_ @JohnLockeNC @PeteKaliner @Chad_Adams @jonpsanders NC SC-2 Trends thru 1/26/21 including current data on graphs to show how things are trending in real time. Discussing thru 1/26 since NCDHHS consistently modifies their dashboard (drives incidence down).
2/ Overall incidence ⬆️ for 11th wk to 8.47% (⬆️ 0.04%). Overall incidence has never been at 5% since testing began; no statistically significant change since the mask mandate.
3/ Daily incid b/w 6.5% & 17.1% (reporting inconsistency; see graph) last 14 days. Avg daily incid (1/1-26) =12.5% (⬆️ 1.6% compared to Dec, stat sig). Avg daily incid each month:
May: 6.8% June: 7.6% July: 8.1%
Aug: 6.9% Sept: 5.7% Oct: 6.4%
Nov: 7.4% Dec: 10.9% 1/1-26: 12.5%
Read 13 tweets
24 Feb
1/ Cooper presser: NC metrics, vaccines (65+ and frontline workers). 3/10 more people eligible. More stdts returning to classroom. Getting kids into classrooms critical for their health. Schools serving 96% is stdts will offer in-school instruction (fails to mention NOT plan A).
2/ SB37: reiterates why he won’t sign, but doesn’t say he’ll veto. (Aside: if it really was about the KIDS, why is he stringing them along? Playing politics w/kids’ lives has deleterious long-term effects.) NC trends ⬇️ & stabilized. Cohen: we’ve used data to guide approach.
2/ NC can be proud of our data quality/transparency. 🙄 Bloomberg rated NC as best in nation on vax race/ethnicity quality. (Aside: this doesn’t mean NC doing well w/vax rollout. Shows data/graphs that eerily resemble other historical virus graphs. Hospitalizations still high.
Read 25 tweets
8 Dec 20
1/ @APDillon_ @JohnLockeNC @NC_Governor @SecMandyCohen Let’s discuss NC Executive Order 180 (governor.nc.gov/documents/exec…) and the evidence/studies cited for having stricter guidelines, shall we?
2/ 1.1st study cited published 6/16/20: data examined included (+) rates 3/31-5/22 anywhere from 1-21 days after mask mandate. Study cites ⬆️ mask use/mandates for 15 states, DC, + 29 counties & NYC. See graphs to compare a few things: timeframe, curve shapes & timeframe to
3/ today (DE, MD, MA). Then compare to some states w/o mandates (SD, GA, SC). Then compare to NC w/our mandate effective on 6/30.
Read 18 tweets

Did Thread Reader help you today?

Support us! We are indie developers!


This site is made by just two indie developers on a laptop doing marketing, support and development! Read more about the story.

Become a Premium Member ($3/month or $30/year) and get exclusive features!

Become Premium

Too expensive? Make a small donation by buying us coffee ($5) or help with server cost ($10)

Donate via Paypal Become our Patreon

Thank you for your support!

Follow Us on Twitter!