
PAY ATTENTION to this series of charts...they determine market direction for the next few weeks...First up...#Nasdaq100 vs. #NASDAQ Has bounced off trend line support. First reversal here after topping out on September 2 at same levels as dot com highs...the final big tech rally. 


Next, we look at Equal Weight #sp500 $spy $RSP vs. the whole #sp500 It has peaked. More evidence of coming big tech final rally...Value stocks about to correct.

Now we look at $IWM Russell 2000 Small Caps index, which has been on a huge tear, and needs to correct desperately. We can see the repetition of what happened in year 2000 dot-com peak. Expect Russell to FINALLY correct...buy the dip!!!!

#NASDAQ vs #SP500 $QQQ $SPY Peaked at same level as dot-com year 2000...Further evidence big tech is headed down. Nasdaq is headed WAY DOWN.

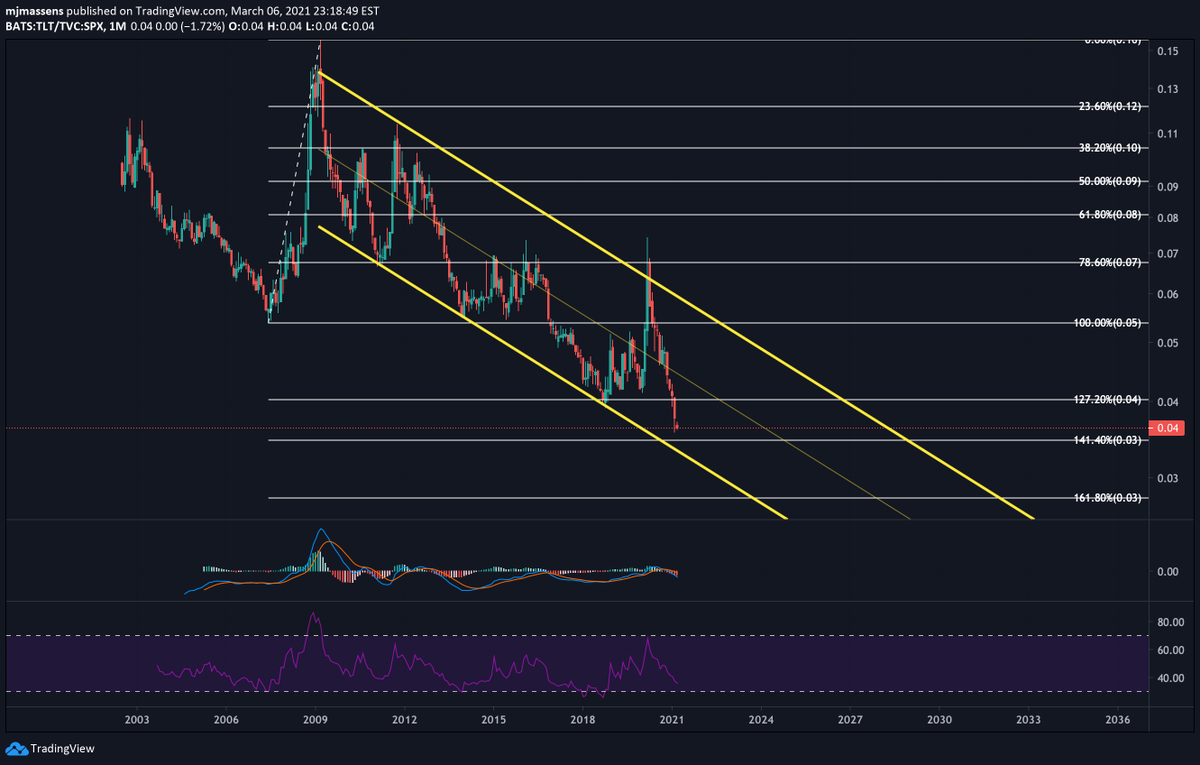
$TLT vs $SPY #SP500 bonds vs Sp500...still have a little ways to go until bonds hit their bottom. Here's another view, inversed, as well for comparison. And finally $TLT all time chart...We overshot top of channel, will now target bottom of channel around $120 area.


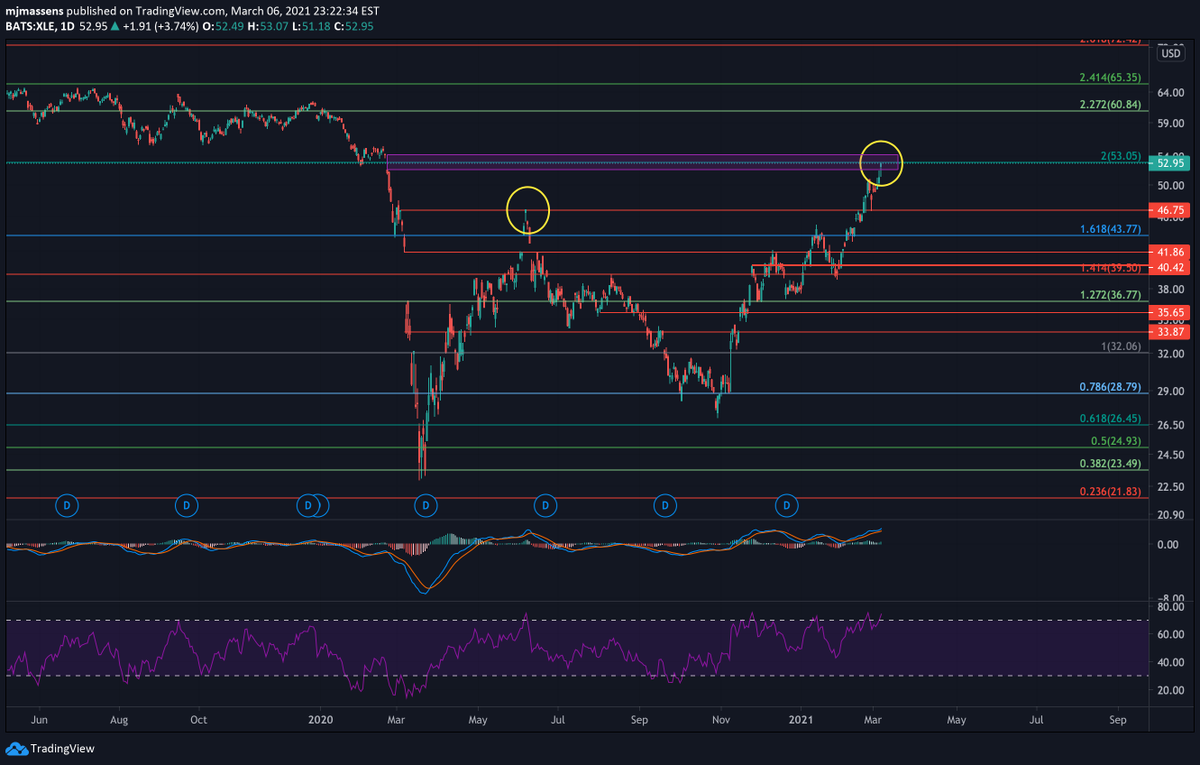
$XLE Energy seems to have topped, at key #fibonacci resistance, with similar candle as June peak. Will it fill the gap? Regardless, energy *should* take a break here. I'd be a buyer on the dip!
$XLK vs $SPY Tech as weight of #sp500 MACD and RSI say we peaked. Couldn't even make it to dot-com era levels...Other charts clearly show big tech peaked. So this may have been it for now...

$XLP vs $SPY Consumer Staples as weight of #sp500...Defensive stocks shine when market is about to go into turbulence. There is VERY bullish divergence on the Daily and Weekly RSI...Do we see reversal up here? Or just one more leg down...regardless, they will tell the tale...

$XLRE vs SP500 Real Estate is a falling knife right now...when will it bottom. Best to wait for reversal pattern. Costar, AMT and others have very bearish crossovers on Daily/Weekly charts. Housing crisis or commercial real estate crisis looming? Evictions, forbearance...

$XLU vs #sp500 Utilities...another falling knife. No clear reversal in sight here, but when it does, they will BOOM to backtest that head and shoulder neckline.

$XLV Healthcare stocks on the big decline. Notice how Pfizer, Moderna and other vaccines have lost their edge despite saving the world. These play kind of like tech darlings...some good names for sure, but a stock picker's market. The 61.8% level seems like possible bounce area.

$XLY vs #sp500 Consumer Discretionary peaked. MACD confirms it. Consumer loans, credit cards on decline proves it. Get out of discretionary sector for now, it seems. Don't know if stimulus package can save this...will need to keep a close eye on this one...


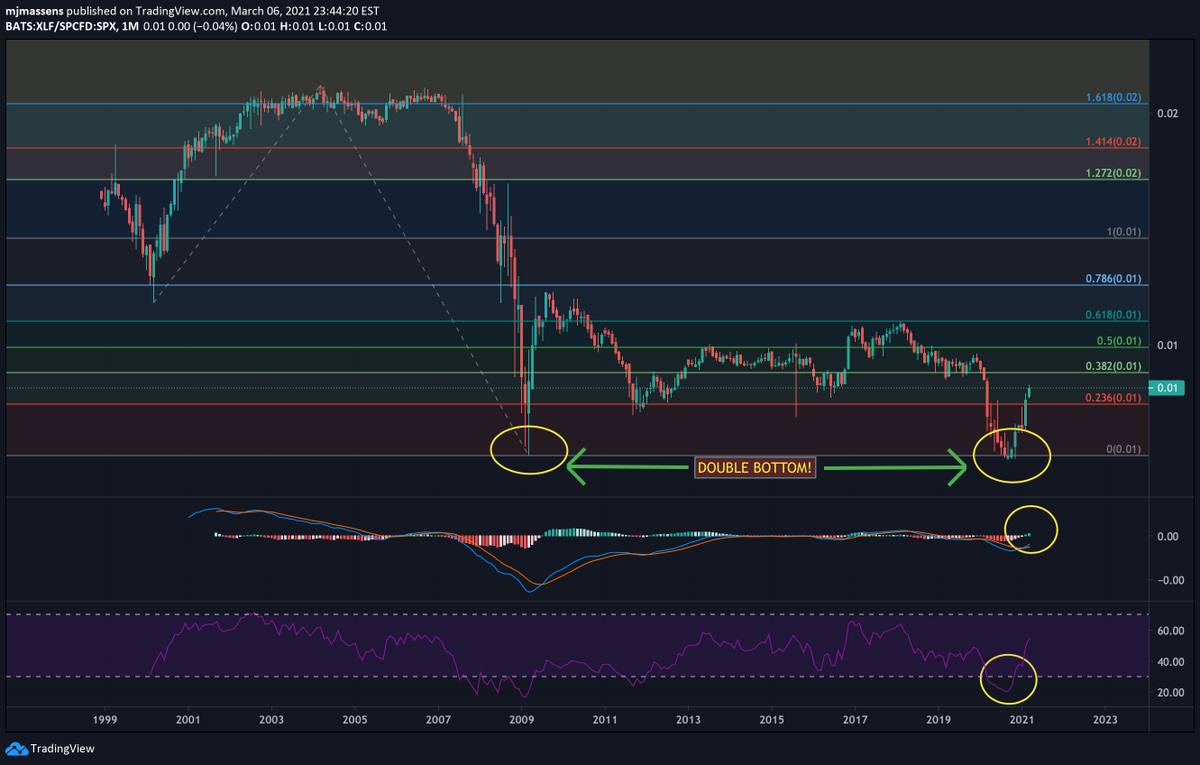
$XLF vs #sp500 Banks have taken over a decade to recharge after the 2008 Financial Crisis. They are leading the way along with Energy. Any pullback should be bought. They comprise a big part of Russell, fyi. Banks lead the way out of recessions, so they say. Here's the proof...
$XLE Energy vs #sp500 Engage rocketship! And I thought Biden would be bad for oil?😂 Buy the pullbacks! This one has legs! (its last legs, perhaps, for oil)

$XLI vs #Sp500 Industrials put in a strong reversal at key level of 61.8% fibonacci from dot-com era high/lows. This is a solid buy, along with energy and financials.

This screams we will see one last push in big tech that may lift Nasdaq to 14,000+ level, and SP500 to 4.2-4.4k level. But obviously big tech trade is over...it's an excuse to let value stocks breath before the real value rally...the reopening trade! Sell big tech into strength!
@DereckCoatney @mikepsilva @optionsmafia1 @MetreSteven @FinanceLancelot @jesusmo38918891 @CordovaTrades @StonkTrump @Gabylanbarros @SqueezeMetrics @coloradotravis @great_martis @xtrends @BlackBox_Team @MasterPandaWu @NorthmanTrader @GreenDoji @yuriymatso @MacroCharts
How high can #Sp500 go? 4,153 is 161.8% Fibonacci off Covid lows. 4,200 261.8% Fib extension off June lows. 4,460 next Fib level off dotcom era lows (3,846 is current level). #Nasdaq in the 14,000+ range.
Sell big tech into strength if we get this push in the Springtime.
Keep an eye on $KO COCA COLA. Currently in a big symmetrical triangle pattern, all the moving averages clustered around it. If Coke pushes up, I'd start to buy Staples as defensive move. If triangle breaks down, then we have more upside in stocks.
Goes without saying, none of this is financial advice! We are still in correction mode until we get bullish crosses on the moving averages! 9 crossing the 20, 20 cross the 50, etc. Nasdaq 12,200 futures must hold, or all this gets invalidated and we reassess.
• • •
Missing some Tweet in this thread? You can try to
force a refresh


