Earlier this week, Alaska made vaccines available to those 16 and older, becoming the first state to remove eligibility requirements. It leads the nation with 17% of its population fully vaccinated. So what can we learn? And what is it sometimes hard to compare states? A thread:
While Alaska is the first state to remove eligibility requirements, effective immediately, other states are expected to do the same in the coming weeks, and certainly before President Biden's deadline on May 1. We will continue to track these.
washingtonpost.com/health/2021/03…
Vaccination plans are complex and in order to make comparisons among states with metrics such as doses per capita and percentage of the population vaccinated, we must consider:
- Supply
- Delivery
- Uptake
- Population characteristics

Let's analyze Alaska with these factors.
First, supply. As @scottieandrew reports, to help make vaccines more cost-efficient, Alaska receives its doses in a big batch monthly. This helps the state plan ahead. Additionally, AK benefits from extra allocations through the Indian Health Service.
cnn.com/2021/03/09/us/…
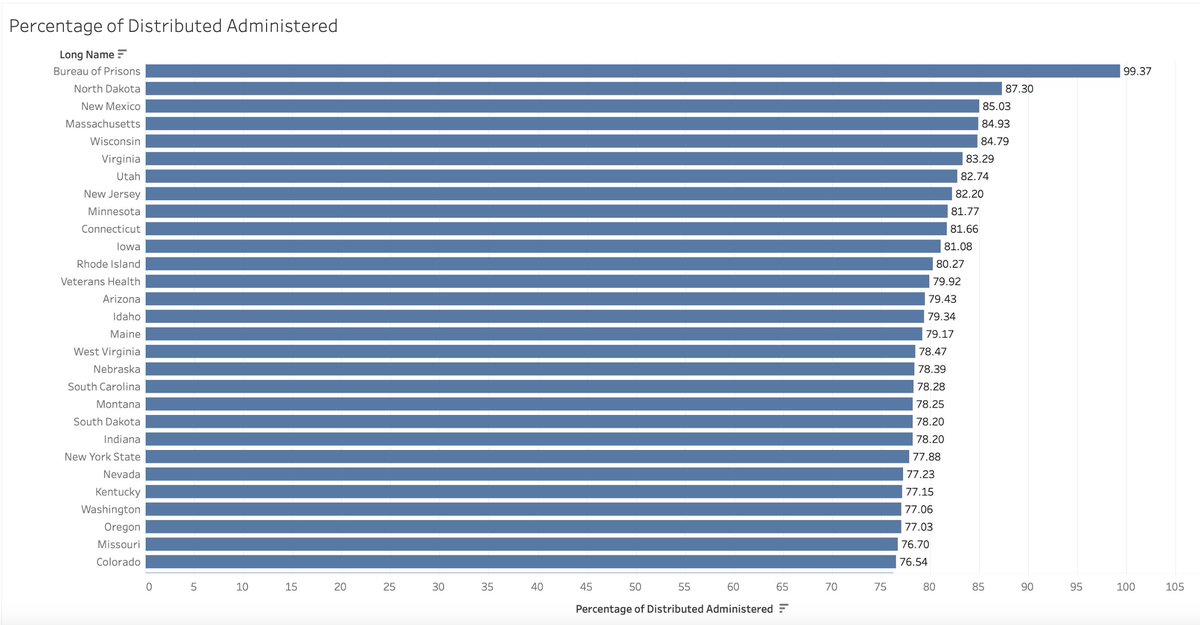
Next, delivery. As @ChelseaCirruzzo reports, Alaska has relied on existing community networks for delivery and uses a hub-and-spoke model from previous vaccination programs. Equity is taken into account and the state uses a wide variety of transportation.
usnews.com/news/best-stat…
Next, uptake. Alaska, like many other states, prioritized the 65+ population. While vaccination rates have been high in this group (more on this in a bit), a recent Census Bureau survey shows Alaska having one of the lowest rates of vaccine enthusiasm.
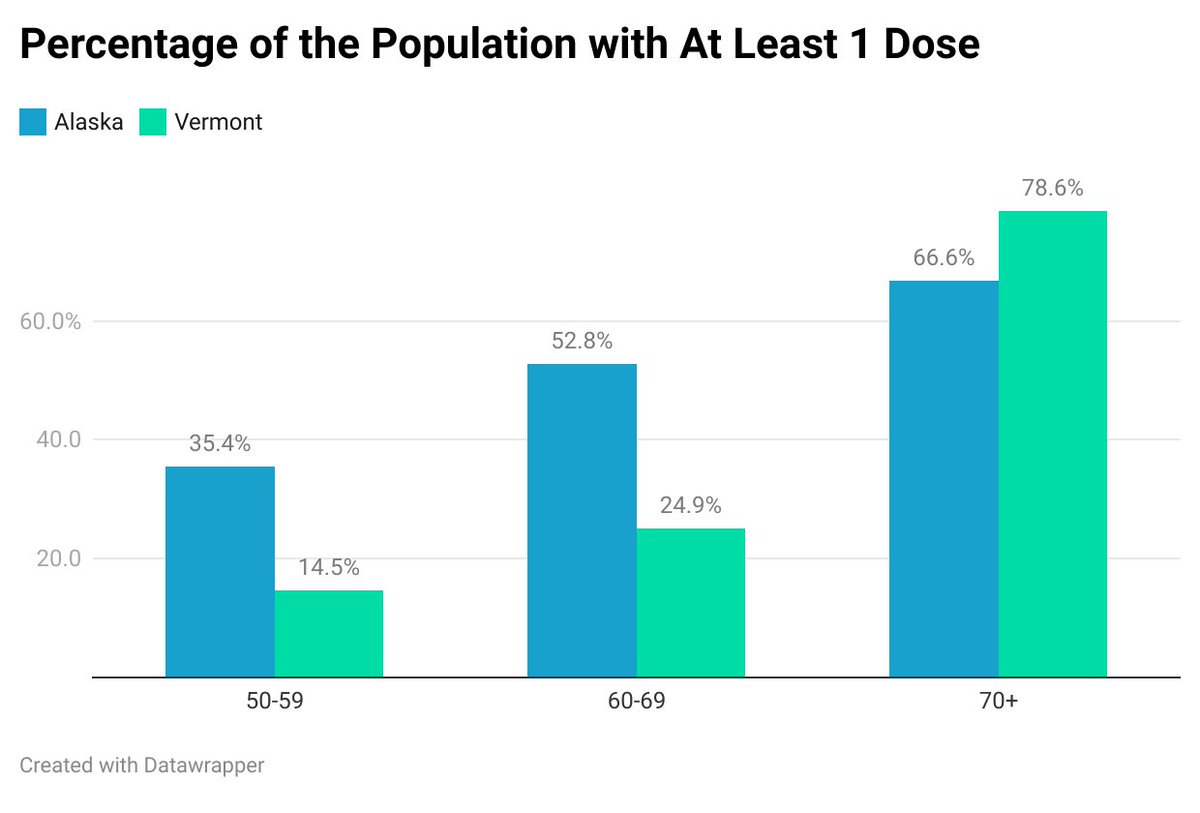
The federal governments allocates doses to states based on its total population, not the population in each "phase." Let's compare Alaska to Vermont. Both have opened vaccines to those over 65, however Vermont has a much older population.
This means that it may take longer (and more doses) for Vermont to move through its 65+ phase than Alaska. Additionally, preliminary data from both states show a higher level of vaccine uptake in the 70+ age group in Vermont compared to Alaska.
These population characteristics are important to understand — as supply ramps up, it is very likely some states will move "faster" through phases than others — likely due to policy decisions, uptake and efficiency. Every plan is different.
nytimes.com/interactive/20…
Over the coming weeks, we need to focus on vaccine delivery channels and ensure that residents in each state have equitable access. As @RWeintraubMD has said, vaccination plans must take into account a combination of speed, scale and equity.
It is for these reasons that it is often difficult to make an apples to apples comparison among states, but we have much to learn from each states' nuanced strategies and best practices. We need to watch the pace of vaccination and make adjustments to serve hard-hit populations.
By May 1, every American will be eligible to register for the vaccine. In the meantime, we must be patient and show our respect for public health officials in each state, who have all been working incredibly hard on distribution plans.
Special thanks to @annezinkmd for her incredible work and transparency with Alaska's Covid-19 response, and our great team here in Vermont.

• • •

Missing some Tweet in this thread? You can try to force a refresh
 

Keep Current with Benjy Renton

Benjy Renton Profile picture

Stay in touch and get notified when new unrolls are available from this author!

Read all threads

This Thread may be Removed Anytime!

PDF

Twitter may remove this content at anytime! Save it as PDF for later use!

Try unrolling a thread yourself!

how to unroll video
  1. Follow @ThreadReaderApp to mention us!

  2. From a Twitter thread mention us with a keyword "unroll"
@threadreaderapp unroll

Practice here first or read more on our help page!

More from @bhrenton

14 Mar
Vaccine data reporting 101:

The CDC pulls numbers from state immunization sites every morning at 6 a.m. (the daily cutoff). It spends the morning verifying these numbers and publishes a public update by 8 p.m. (usually some time in the afternoon).
Today, the CDC reported 2,977,732 doses by the 6 a.m. cutoff (a record regardless) and then had a delay in data syncing, resulting in 4,575,496 new doses administered that were reported. This means tomorrow's numbers will be slightly lower than usual.
As per usual, doses are reported two ways: by the day they are reported (right) and the day they are actually administered (left). The graph on the left is backfilled each day as states report more doses. However, we often use the graph on the right for daily vaccinations. Image
Read 5 tweets
10 Mar
2,028,692 doses have been reported administered in the last 24 hours, according to the CDC. 24.4% of adults have received a first dose.

Doses Delivered: 127,869,155
Doses Administered: 95,721,290

74.9% of delivered doses have been administered.
public.tableau.com/views/COVID-19… Image
North Dakota leads the nation with 87.3% of shots used. The percentage of supply used is merely one metric to compare states, and soon the dashboard will have more metrics for you to use. The 7-day average is now 2.17 million doses per day. Image
15.7 million doses of Pfizer and Moderna doses have been allocated for jurisdictions next week. The dashboard has been updated with the latest allocations.
Read 4 tweets
10 Mar
It's important to note that each state has different population characteristics that could affect the speed of its vaccination rollout. For example 7.5% of residents in Alaska are over the age of 70, compared to 13.4% in Vermont. State governments often know what is best.
This is not necessarily endorsing a particular state's strategy. Rather, it is stating the fact that states are allocated doses based on its general adult population, not according to each state's individual strategy. States using an aged-based system may take…
…longer to move through age bands, particularly if the average age is older than other states. Additionally, vaccine uptake plays a huge role — some states have ensured high uptake in each group before moving on to the next one.
Read 4 tweets
20 Feb
1,847,276 doses have been reported administered in the last 24 hours, according to the CDC. All states reported doses delivered and administered.

Doses Delivered: 78,152,495
Doses Administered: 59,585,043

76.2% of delivered doses have been administered.
public.tableau.com/views/COVID-19…
Will post more data in the coming days detailing how severe weather is affecting vaccine deliveries, as the White House announced today 6 million doses are backlogged and will be shipped very shortly. Deliveries and reporting systems are recovering — look at the green uptick.
North Dakota now leads the nation with 95% of shots used. This number will drop for all states as supply is replenished.
Read 4 tweets
19 Feb
Just over 21,000 vaccine doses were reported administered in Texas in the last 24 hours, the latest in a series of fallbacks after severe weather has disrupted vaccination sites and reporting systems. The number of doses allocated to the state has not changed in 3 days. Image
In the last 24 hours, 46% of counties reported fewer than 10 doses administered. Compared with last Thursday, almost all counties are reporting fewer new doses administered by a large margin. It may take days for the infrastructure to recover and reporting to catch up. Image
"Any delays, the timing could not be worse," @PeterHotez said on @CNNTonight last night.
Read 4 tweets
18 Feb
1,455,940 doses have been reported administered in the last 24 hours, according to the CDC. Rebound is slow from the weekend due to supply issues.

Doses Delivered: 73,377,450
Doses Administered: 57,737,767

77.7% of delivered doses have been administered.
public.tableau.com/views/COVID-19… Image
New Mexico leads the nation with 100.4% of delivered doses administered — this is most likely due to the counting of the sixth dose in Pfizer vials. The 7-day average is 1.62 million doses/day. Image
Many states did not report deliveries of doses due to severe weather.
Read 4 tweets

Did Thread Reader help you today?

Support us! We are indie developers!


This site is made by just two indie developers on a laptop doing marketing, support and development! Read more about the story.

Become a Premium Member ($3/month or $30/year) and get exclusive features!

Become Premium

Too expensive? Make a small donation by buying us coffee ($5) or help with server cost ($10)

Donate via Paypal Become our Patreon

Thank you for your support!

Follow Us on Twitter!