The CDC pulls numbers from state immunization sites every morning at 6 a.m. (the daily cutoff). It spends the morning verifying these numbers and publishes a public update by 8 p.m. (usually some time in the afternoon).
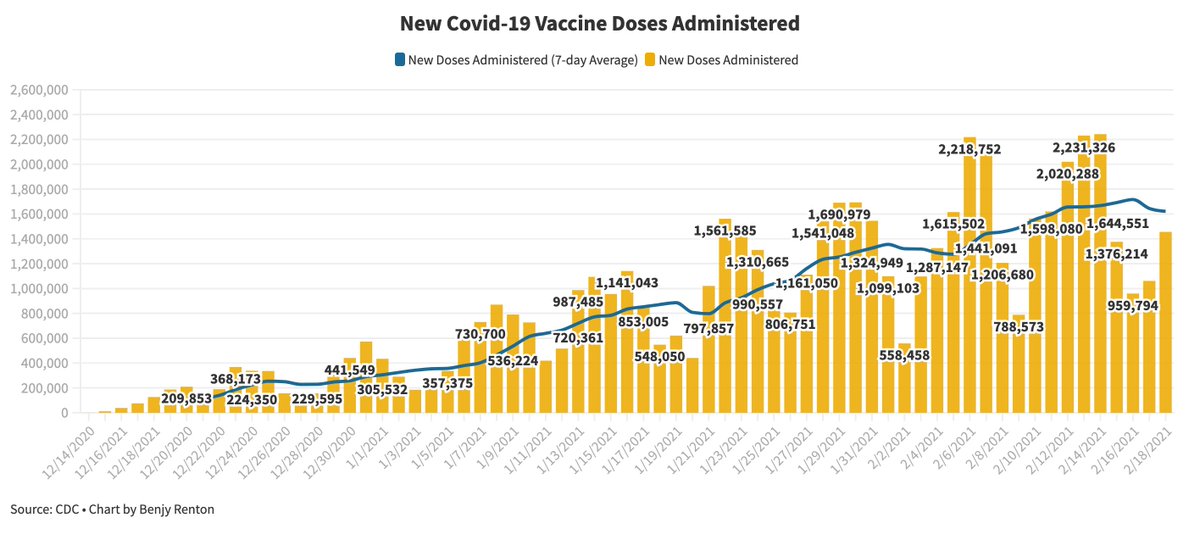
Today, the CDC reported 2,977,732 doses by the 6 a.m. cutoff (a record regardless) and then had a delay in data syncing, resulting in 4,575,496 new doses administered that were reported. This means tomorrow's numbers will be slightly lower than usual.
As per usual, doses are reported two ways: by the day they are reported (right) and the day they are actually administered (left). The graph on the left is backfilled each day as states report more doses. However, we often use the graph on the right for daily vaccinations.
Could this increase be a result of state backlogs? Sure, it's possible, especially in large states. However, they only play quite a small role in today's large number.
Key points, regardless of this anomaly:
- Today was a huge day for vaccinations
- 7-day average is increasing
Thank you to @cyrusshahpar46 and the data scientists at the CDC for keeping us updated.
• • •
Missing some Tweet in this thread? You can try to
force a refresh
Earlier this week, Alaska made vaccines available to those 16 and older, becoming the first state to remove eligibility requirements. It leads the nation with 17% of its population fully vaccinated. So what can we learn? And what is it sometimes hard to compare states? A thread:
While Alaska is the first state to remove eligibility requirements, effective immediately, other states are expected to do the same in the coming weeks, and certainly before President Biden's deadline on May 1. We will continue to track these. washingtonpost.com/health/2021/03…
Vaccination plans are complex and in order to make comparisons among states with metrics such as doses per capita and percentage of the population vaccinated, we must consider:
- Supply
- Delivery
- Uptake
- Population characteristics
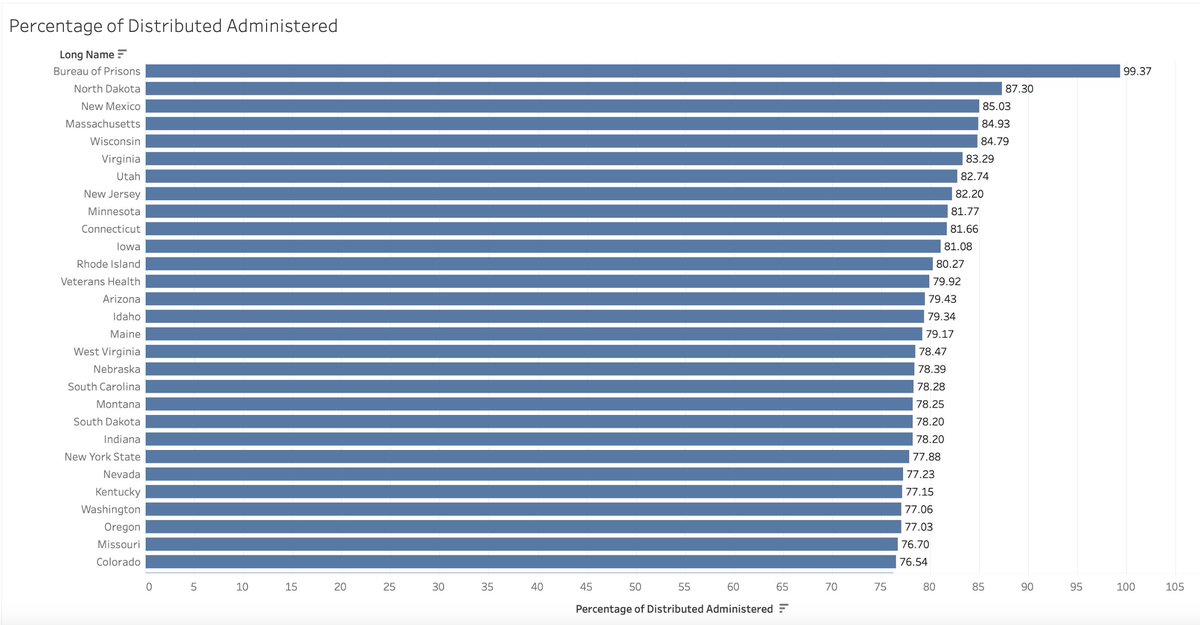
North Dakota leads the nation with 87.3% of shots used. The percentage of supply used is merely one metric to compare states, and soon the dashboard will have more metrics for you to use. The 7-day average is now 2.17 million doses per day.
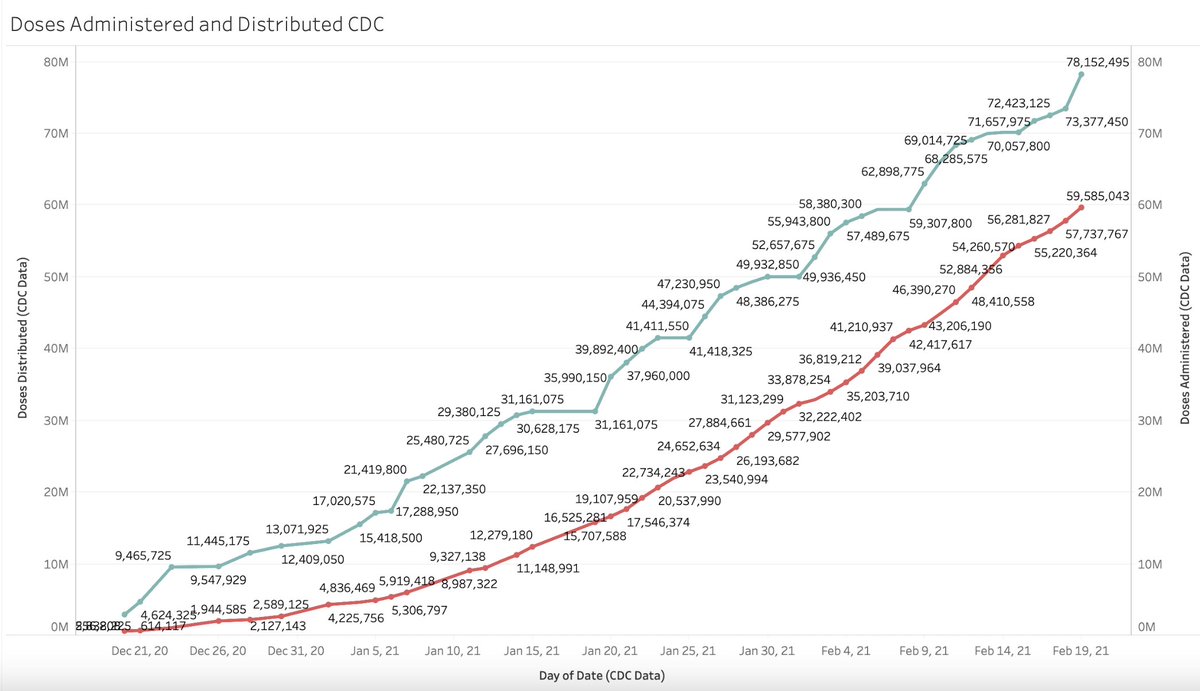
15.7 million doses of Pfizer and Moderna doses have been allocated for jurisdictions next week. The dashboard has been updated with the latest allocations.
It's important to note that each state has different population characteristics that could affect the speed of its vaccination rollout. For example 7.5% of residents in Alaska are over the age of 70, compared to 13.4% in Vermont. State governments often know what is best.
This is not necessarily endorsing a particular state's strategy. Rather, it is stating the fact that states are allocated doses based on its general adult population, not according to each state's individual strategy. States using an aged-based system may take…
…longer to move through age bands, particularly if the average age is older than other states. Additionally, vaccine uptake plays a huge role — some states have ensured high uptake in each group before moving on to the next one.
Will post more data in the coming days detailing how severe weather is affecting vaccine deliveries, as the White House announced today 6 million doses are backlogged and will be shipped very shortly. Deliveries and reporting systems are recovering — look at the green uptick.
North Dakota now leads the nation with 95% of shots used. This number will drop for all states as supply is replenished.
Just over 21,000 vaccine doses were reported administered in Texas in the last 24 hours, the latest in a series of fallbacks after severe weather has disrupted vaccination sites and reporting systems. The number of doses allocated to the state has not changed in 3 days.
In the last 24 hours, 46% of counties reported fewer than 10 doses administered. Compared with last Thursday, almost all counties are reporting fewer new doses administered by a large margin. It may take days for the infrastructure to recover and reporting to catch up.
"Any delays, the timing could not be worse," @PeterHotez said on @CNNTonight last night.
New Mexico leads the nation with 100.4% of delivered doses administered — this is most likely due to the counting of the sixth dose in Pfizer vials. The 7-day average is 1.62 million doses/day.
Many states did not report deliveries of doses due to severe weather.