
Conducting study on how we would have done if we would have bought every valid #IPOBase breakout since 2017. This will help us in finding the success rate of IPO bases and also in identification of the characteristics of a high probability setup. While I wish to publish (1/n)
complete study & the results on completion, but as it includes too many stocks and multiple charts of each setup, it will become too much complicated to publish on twitter. Hence I will share some #CaseStudies here which I hope will be beneficial not only in understanding (2/n)
IPO bases but also trade management, scaling in & out, identification of warning signs and selling into weakness.
To achieve consistent success in trading, it is essential for us to reduce subjectivity in trading though we can't eliminate it completely. So, am following (3/n)
To achieve consistent success in trading, it is essential for us to reduce subjectivity in trading though we can't eliminate it completely. So, am following (3/n)
some basic rules throughout this study-
Setup Rules
1) Sign of demand for the IPO- should list at premium. Will prefer if we have few days of buying post listing.
2) Should form left side high of the base within first 5 weeks of trading.
3) Depth - preferably 20% to 30% (4/n)
Setup Rules
1) Sign of demand for the IPO- should list at premium. Will prefer if we have few days of buying post listing.
2) Should form left side high of the base within first 5 weeks of trading.
3) Depth - preferably 20% to 30% (4/n)
4) Duration - 2 to 5 weeks (if we are seeing some supportive action within 5 weeks of basing we can make an exception)
5) Breakout on heavy volume.
Trade Management Rules-
1) Standard entry will be at the breakout of the left side high of the base into new high ground. (5/n)
5) Breakout on heavy volume.
Trade Management Rules-
1) Standard entry will be at the breakout of the left side high of the base into new high ground. (5/n)
2) Will take cheat entries if available to pre-empt the trade & manage the risk at standard breakout level.
3) Will hold for 8 weeks without unnecessary interruption if the stock sustains above our pivot for 3 weeks post breakout. Will exit if initial SL is taken out. (6/n)
3) Will hold for 8 weeks without unnecessary interruption if the stock sustains above our pivot for 3 weeks post breakout. Will exit if initial SL is taken out. (6/n)
4) Will average up if the stock gives us any valid entry such as any standard base, 3 week tight closings, shakeouts, continuation cheat areas with pocket pivots etc.
05) Will scale out if stock is exhibits severe warning signs & signs of weakness. Here, I will exit the (7/n)
05) Will scale out if stock is exhibits severe warning signs & signs of weakness. Here, I will exit the (7/n)
averaged up quantity only while keeping the initial quantity intact for a decisive exit signal. (O'Neil's rule)
6) As IPO bases have huge potential, we will take only decisive exits by selling into weakness - decisive break below 50 day EMA will be ultimate exit signal (8/n)
6) As IPO bases have huge potential, we will take only decisive exits by selling into weakness - decisive break below 50 day EMA will be ultimate exit signal (8/n)
So these are the rules for the study. Now we will start our first #CaseStudy here of #DMART #AvenueSupermart. This IPO was open for subscription from 8th March 2017 to 10 March 2017 while the stock got listed on 21st March. It got 104x subscription while get listed at 102% (9/n)
premium. Lets see how it acted post listing.
While we are supposed to see the action on weekly first, but here we will miss our first IPO base in the stock, if we will not see it on daily. Stock made its left side high on the 2nd day of trading, and formed 8.5% deep base (10/n)
While we are supposed to see the action on weekly first, but here we will miss our first IPO base in the stock, if we will not see it on daily. Stock made its left side high on the 2nd day of trading, and formed 8.5% deep base (10/n)
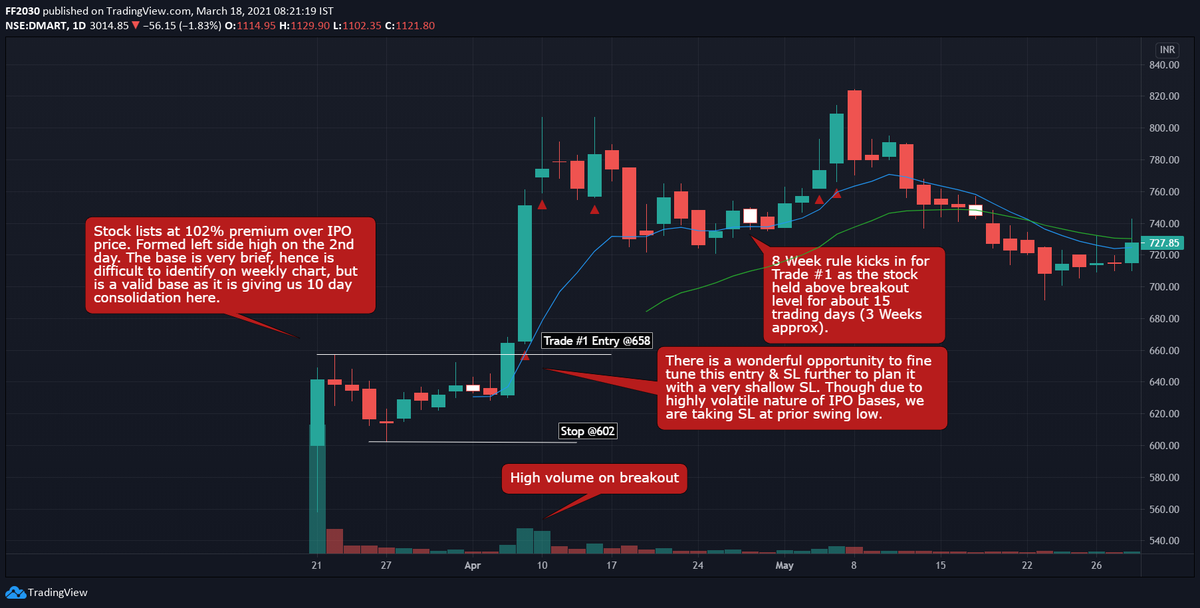
over next 10 days. The stock gave us standard entry on April 06th, 2017 at ₹658. Our stop will be at the low of the base which is 8.5% deep, around our acceptable level. The way stock was acting post listing is highly promising as it is not showing any unusual volatility (11/n)
which is common in IPO bases. Breakout too happened with heavy volume and stock comfortably held above our entry level for next 3 weeks triggering the 8 week hold rule.
Meanwhile, the stock forms the second base of IPO family. The setup looks promising, with a depth of (12/n)
Meanwhile, the stock forms the second base of IPO family. The setup looks promising, with a depth of (12/n)
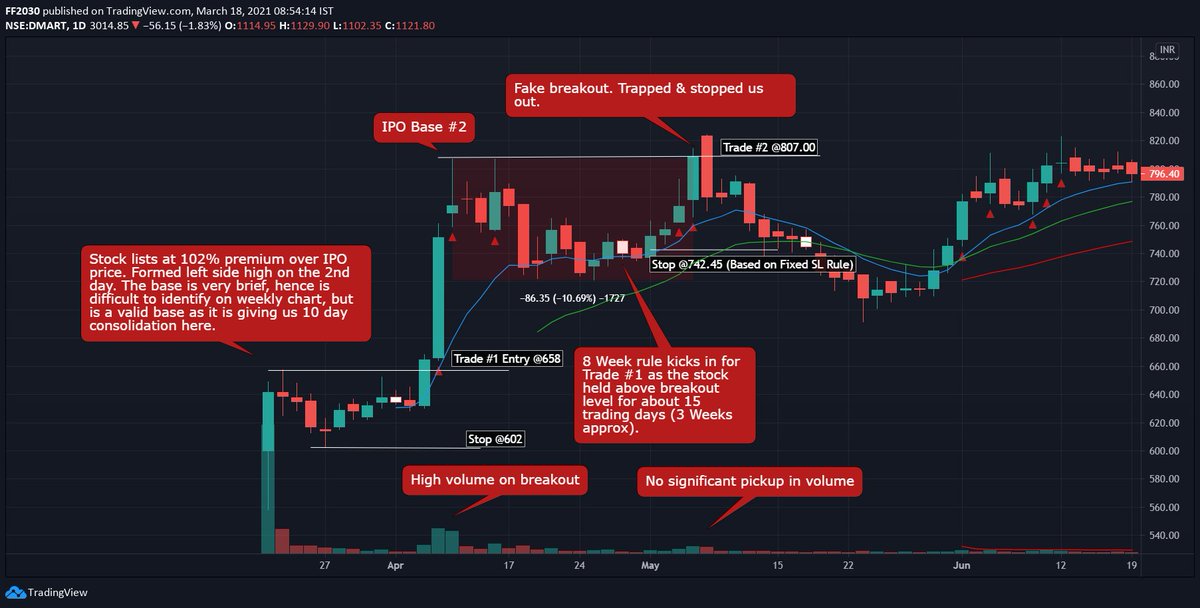
around 10.5% & duration of 17 days. There was some tight bottoming action as well, making the setup promising. Here we will take our standard entry at ₹807, while our SL will be at ₹742, which is 8% deep from entry. This is fixed SL technique used by O'Neil which am (13/n)
using here because my preferred MS based SL will be 10.5% deep.
Stock gave us entry on 5th May, 2017, but immediately came back to undercut our SL in only 6 days. We will accept the loss of 1R and close our trade. Our first entry is intact, as it is under 8 week hold (14/n)
Stock gave us entry on 5th May, 2017, but immediately came back to undercut our SL in only 6 days. We will accept the loss of 1R and close our trade. Our first entry is intact, as it is under 8 week hold (14/n)
rule & doing well enough.
The stock falls below 20 DEMA but refused to fall more despite having no support below. I take this as a sign of strength as the stock is not exhibiting weakness even in adverse situation. Instead it tightened below 20 day line & starts resetting (15/n)
The stock falls below 20 DEMA but refused to fall more despite having no support below. I take this as a sign of strength as the stock is not exhibiting weakness even in adverse situation. Instead it tightened below 20 day line & starts resetting (15/n)
the base again. Considering it as a base reset for the failed setup, we will attempt again when the stock breaks out.
Meanwhile, the 8th week concluded on the week ending on 22nd May for our first entry. The stock is acting well, hence will trail with 50 day EMA. (16/n)
Meanwhile, the 8th week concluded on the week ending on 22nd May for our first entry. The stock is acting well, hence will trail with 50 day EMA. (16/n)
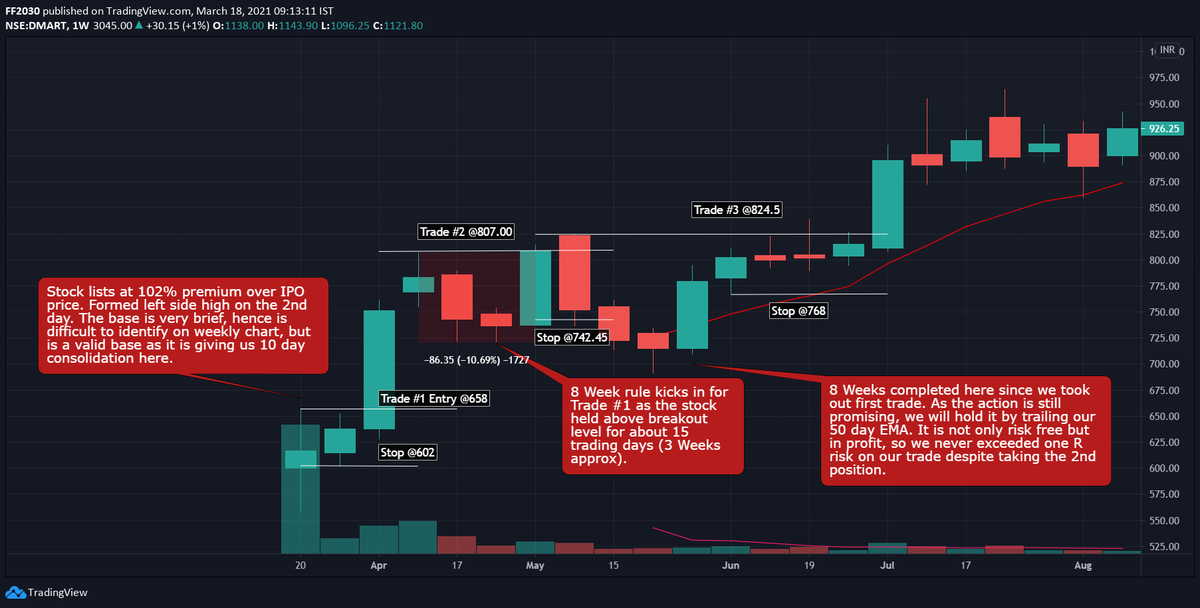
Stock resets the 2nd IPO base and gave us an entry on 20th June 2017 at ₹824. This is our third trade in the stock. Tight action at the bottom and 3WTC setup in the handle area is making the stock very much promising. While we can place our SL too tight at ₹789, which (17/n) 
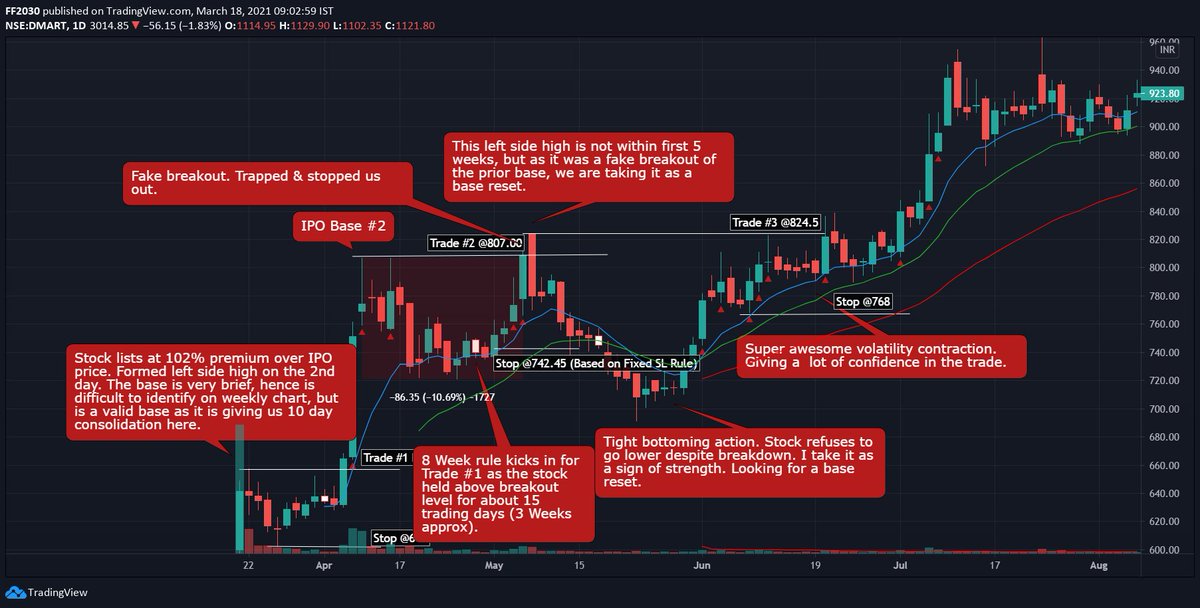
will be just 4.25%, I decided to give it a little room & place it at ₹768 which is again a support area. This is 6.85% deep.
Stock comfortably sustained above the entry for 3 weeks post breakout, triggering 8 week hold rule for IPO bases for our 2nd position.
Stock comfortably sustained above the entry for 3 weeks post breakout, triggering 8 week hold rule for IPO bases for our 2nd position.
Meanwhile, the stock starts basing again during this period, which was 6 week long & 9% deep, qualifying as a standard #FlatBase setup, offering us another trading opportunity. The base also had a small shakeout.
It is also important to keep in mind that we are in a very (19/n)
It is also important to keep in mind that we are in a very (19/n)
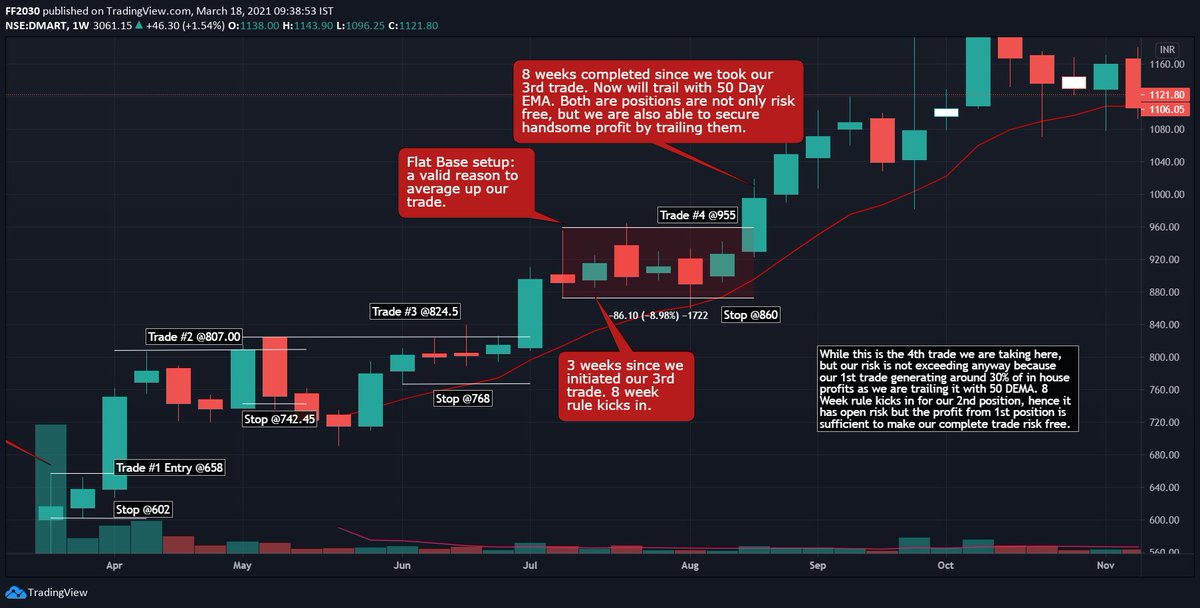
comfortable situation in terms of total open risk. Our 1st position is at 30% profit at trailing stoploss level, which is around 4R. This in house profit is sufficient to fund our both positions with open risk - our 2nd position which is under 8 week hold and also this (20/n)
averaging up opportunity.
There is no reason to deny this opportunity. Our trade triggered on 22nd August, 2017 at ₹955 with the SL below the low of the base at ₹860. This is little deep, around 10%.
Our second open position too came out of the 8 week hold in the week (21/n)
There is no reason to deny this opportunity. Our trade triggered on 22nd August, 2017 at ₹955 with the SL below the low of the base at ₹860. This is little deep, around 10%.
Our second open position too came out of the 8 week hold in the week (21/n)
starting on 21st August. The stock is comfortably sustaining above our entry, and acting well hence we will hold this position again with 50 day EMA. Our both positions are well profitable with 50 DEMA being above our entries.
The stock gave small shakeout at 50 EMA on (22/n)
The stock gave small shakeout at 50 EMA on (22/n)
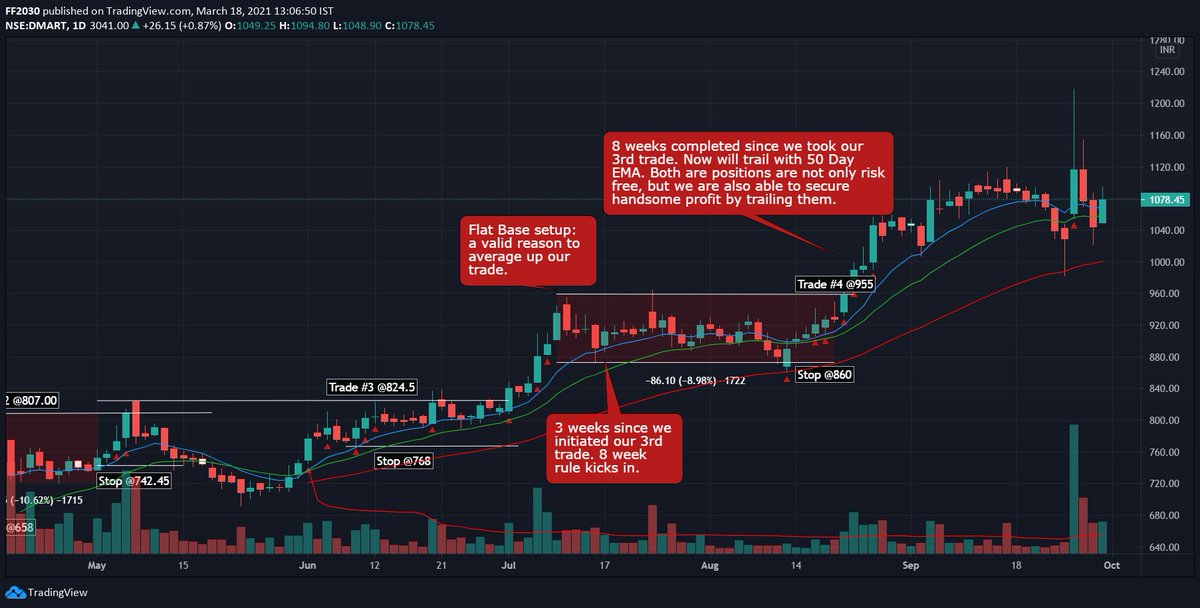
25th Sept. Though we are taking decisive exit, hence it didn't triggered exit for us.
But the action become little volatile, made a rapid run above 10 EMA, look extended & also the volume on red bars increased. Due to multiple warnings we should consider scaling out a (23/n)
But the action become little volatile, made a rapid run above 10 EMA, look extended & also the volume on red bars increased. Due to multiple warnings we should consider scaling out a (23/n)
little bit because we had 3 open positions in the stock. We will scale out our averaged up position at ₹1132 on 23rd Oct, 2017 when the stock gave a range expansion and broke below 20 EMA on heavy volume. We will keep on holding our other 2 positions for a decisive break. (24/n) 
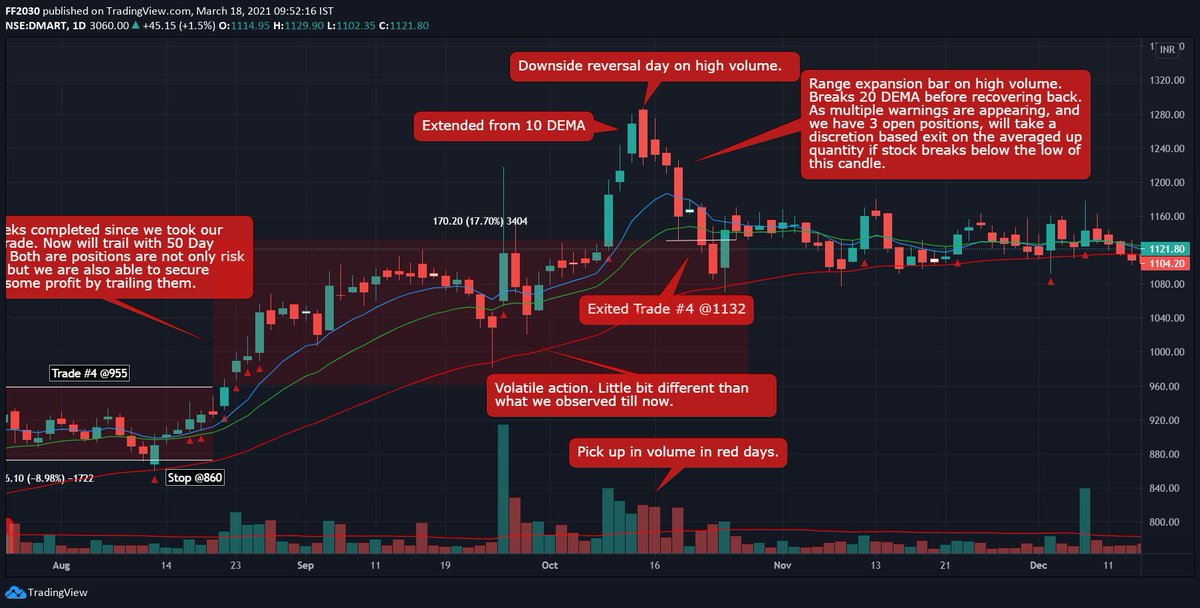
Later the stock decisively breaks below 50 day line by undercutting the low of the candle which closed below the MA. We will close our remaining position at ₹1096 on 18th Dec 2017. (25/n) 
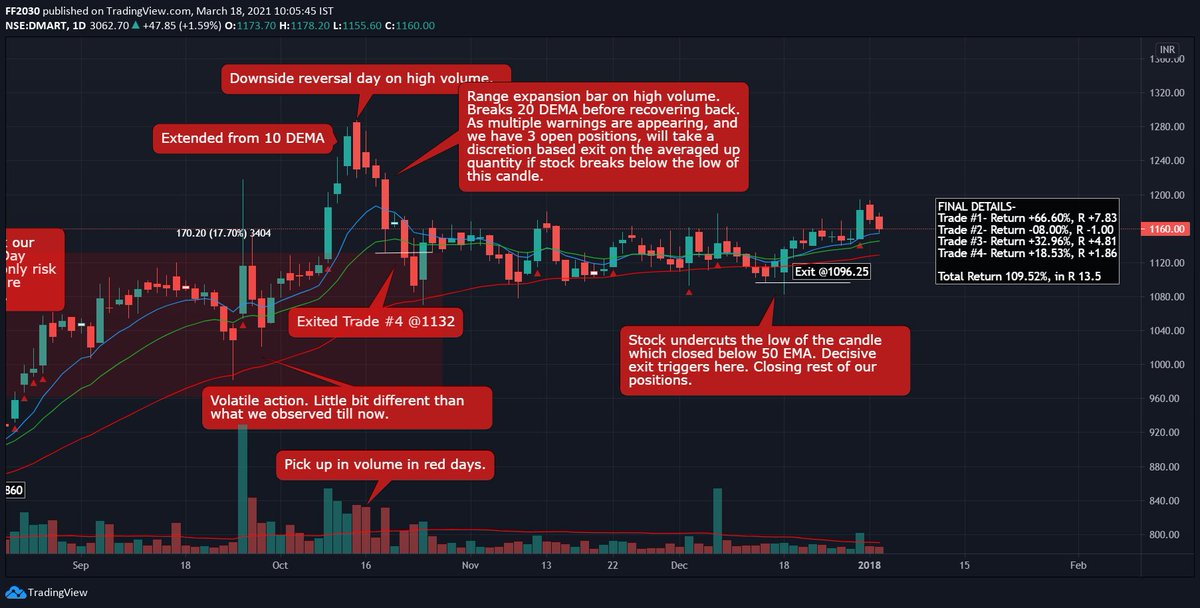
Net proceeds from the trade -
Trade #1- Return +66.60%, R +7.83
Trade #2- Return -08.00%, R -1.00
Trade #3- Return +32.96%, R +4.81
Trade #4- Return +18.53%, R +1.86
Total Return 109.52%, R +13.5. (26/n)
Trade #1- Return +66.60%, R +7.83
Trade #2- Return -08.00%, R -1.00
Trade #3- Return +32.96%, R +4.81
Trade #4- Return +18.53%, R +1.86
Total Return 109.52%, R +13.5. (26/n)
This is the first #CaseStudy am publishing from my ongoing study on #IPOBases. If you find it useful, kindly help reaching it to more people, this will motivates me to publish more in near future.
Concluding now! Thank You for patiently going through this long thread!
(27/27)
Concluding now! Thank You for patiently going through this long thread!
(27/27)
• • •
Missing some Tweet in this thread? You can try to
force a refresh


