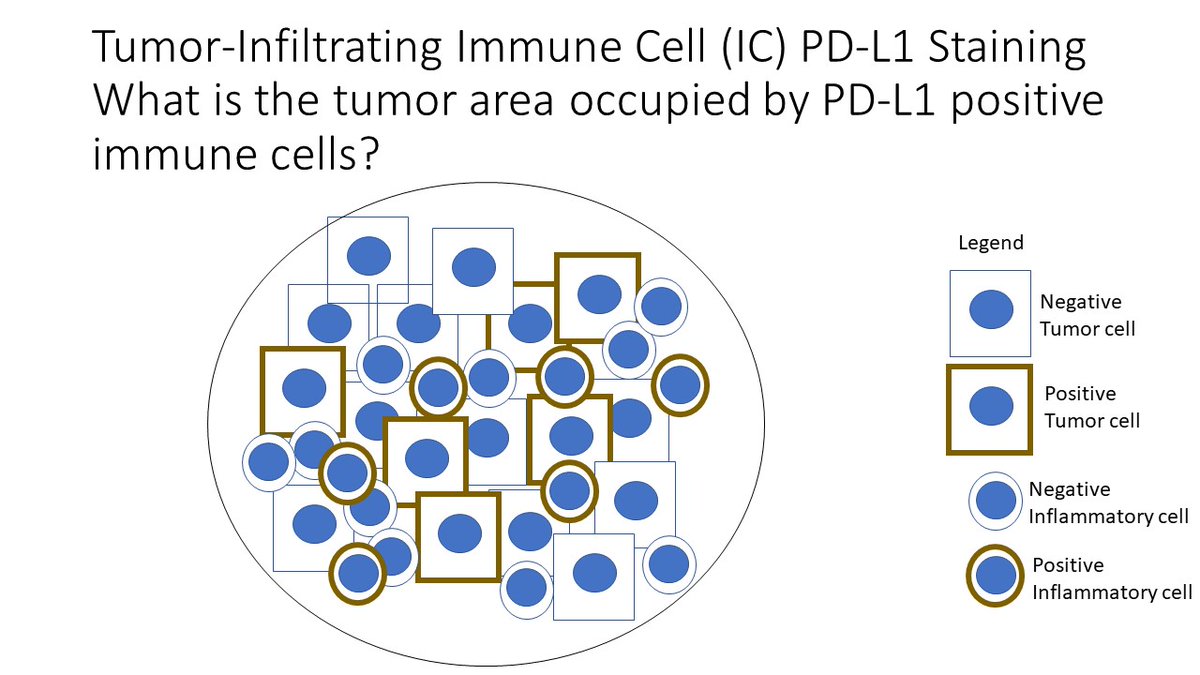
I am putting together a talk on PD-L1 and I have developed some cartoons to help describe the different scoring systems and provide a visual easy to understand picture of how #Pathologists interpret PD-L1
There are three major scoring systems that are used for PD-L1
TPS (Tumor proportion score)
CPS (Combined Positive Score)
IC (Immune cell score)
We can use cartoons to conceptualize what these mean.
TPS (Tumor proportion score)
CPS (Combined Positive Score)
IC (Immune cell score)
We can use cartoons to conceptualize what these mean.

We can then build a cartoon version of a tumor to help understand how these PD-L1 scores may differ between tumors and the challenge in interpreting them
Lets start with the TPS score
Lets start with the TPS score

What do you think is the PD-L1 TPS score for this case?
Answers will be at the end, lets move on to the next CPS score.
Note: The tumor cartoon is the same between the two images
Note: The tumor cartoon is the same between the two images

What is the PD-L1 CPS score for this case?
Remember it is not a percent but a "score"
Remember it is not a percent but a "score"
What is the IC score for this tumor?
Ok lets make it a bit easier;
As you can see the PD-L1 score varies based on the scoring system that you use.
As you can see the PD-L1 score varies based on the scoring system that you use.

This is a simplified example where there are only 17 tumor cells to count. In real cases the minimum number of cells for most assays is 100 cells. In many cases the #pathologist must look at slides that contain thousands of tumor cells and generate an overall score for the tumor
I hope this mini-tweetorial is useful.
Feel free to use and share my cartoons. Share them with non-pathologist colleagues and let them try to score PD-L1.
@smlungpathguy @IHC_guy @SansanoValero @raghupillappa @MelanieBoisMD @TristanRutland7 @natasharekhtman @thoracicpath
Feel free to use and share my cartoons. Share them with non-pathologist colleagues and let them try to score PD-L1.
@smlungpathguy @IHC_guy @SansanoValero @raghupillappa @MelanieBoisMD @TristanRutland7 @natasharekhtman @thoracicpath
I should also mention that the CPS score is the fraction multiplied by 100
• • •
Missing some Tweet in this thread? You can try to
force a refresh
