
$BTC - The next major cycle top
1/
In this THREAD I'm going to explore the idea in detail, why I think the next major local or the major top could be at
$120.000 end of April 2021
#bitcoin #BTC
1/
In this THREAD I'm going to explore the idea in detail, why I think the next major local or the major top could be at
$120.000 end of April 2021
#bitcoin #BTC
2/ First of all, it is important to get a feeling at what point we are in the current cycle.
Bitcoin "Rainbow" Chart (Log regression chart)
In the chart below you can see, that we are now entering the FOMO phase, similar to late Nov 2017 or late Oct 2013.
Bitcoin "Rainbow" Chart (Log regression chart)
In the chart below you can see, that we are now entering the FOMO phase, similar to late Nov 2017 or late Oct 2013.

3/ Every time we enter the FOMO phase, there is a fast last parabolic move to the final cycle top.
Let's have a deeper look, when and at what price this parabolic move could start.
The Bitcoin Investor Tool
Every time the red line breaks, the parabolic move starts.
Let's have a deeper look, when and at what price this parabolic move could start.
The Bitcoin Investor Tool
Every time the red line breaks, the parabolic move starts.

4/ The question is, are we still in phase "2" comparing to 2017 or are we in the progress of entering the "3".
The following indicators are more on the Phase 3 side
PI Cycle Top Indicator
The following indicators are more on the Phase 3 side
PI Cycle Top Indicator
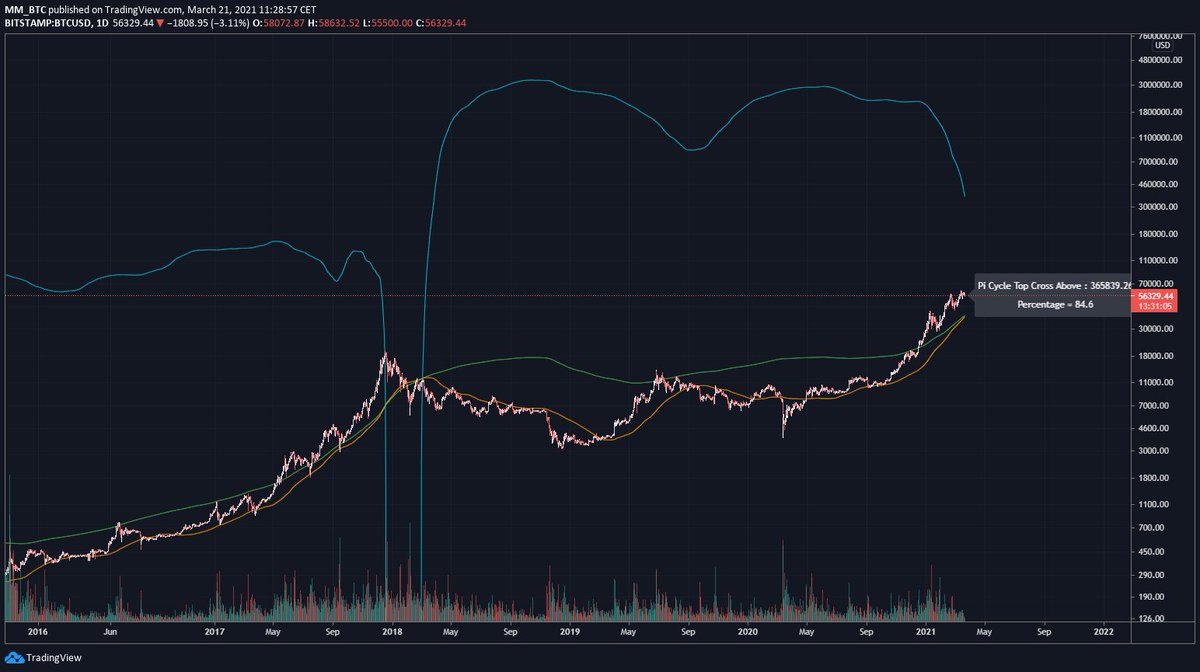
A little bit concerning, the cross will happen soon, if we don't move aggressively to the upside.
This could be indicating that the parabolic move have to start in the next weeks, or the top is in.
This could be indicating that the parabolic move have to start in the next weeks, or the top is in.
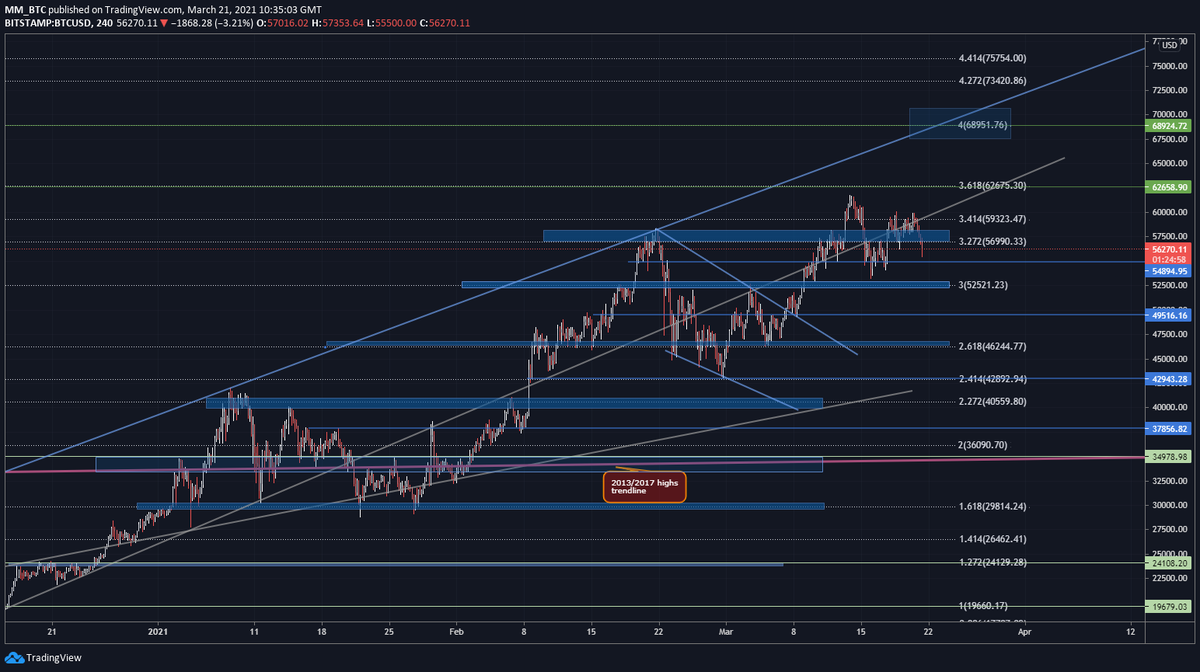
5/ The start of this move should take place, if we take out the upper blue trend line at about $68k - $70k.
Much confluence there.
Much confluence there.
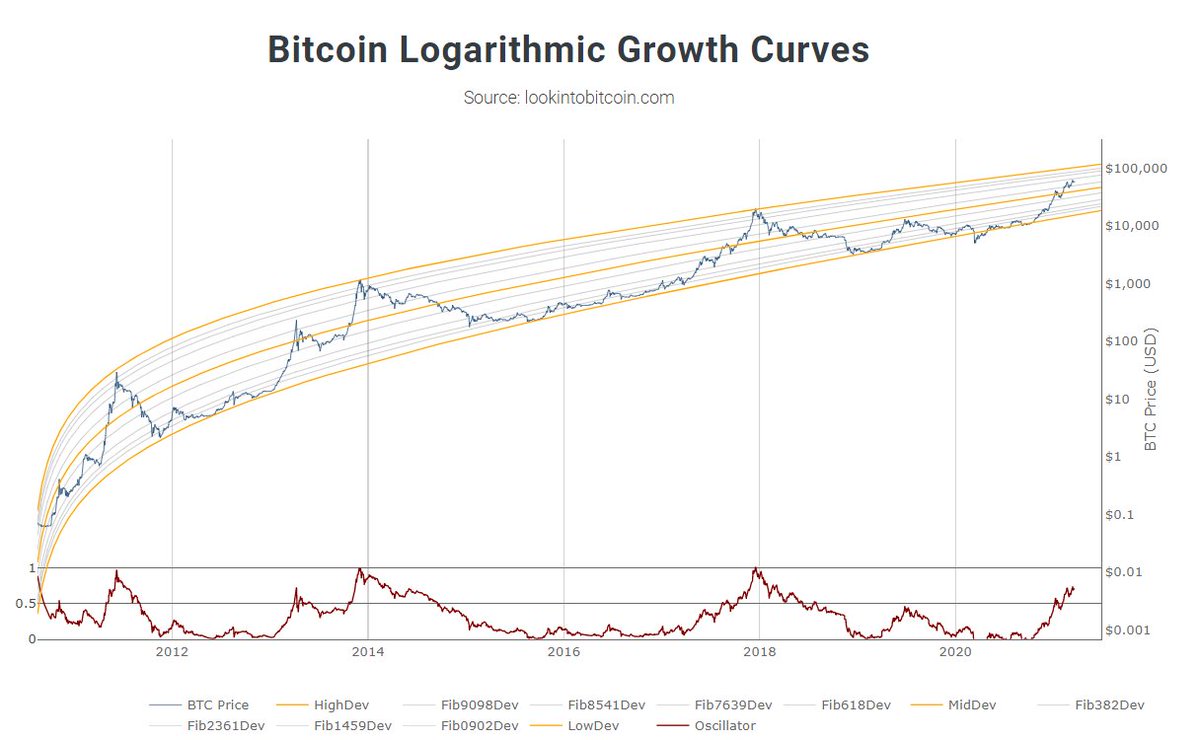
6/
Logarithmic Growth Curves
All the Log Growth Curve models out there also support this assumption.
Logarithmic Growth Curves
All the Log Growth Curve models out there also support this assumption.
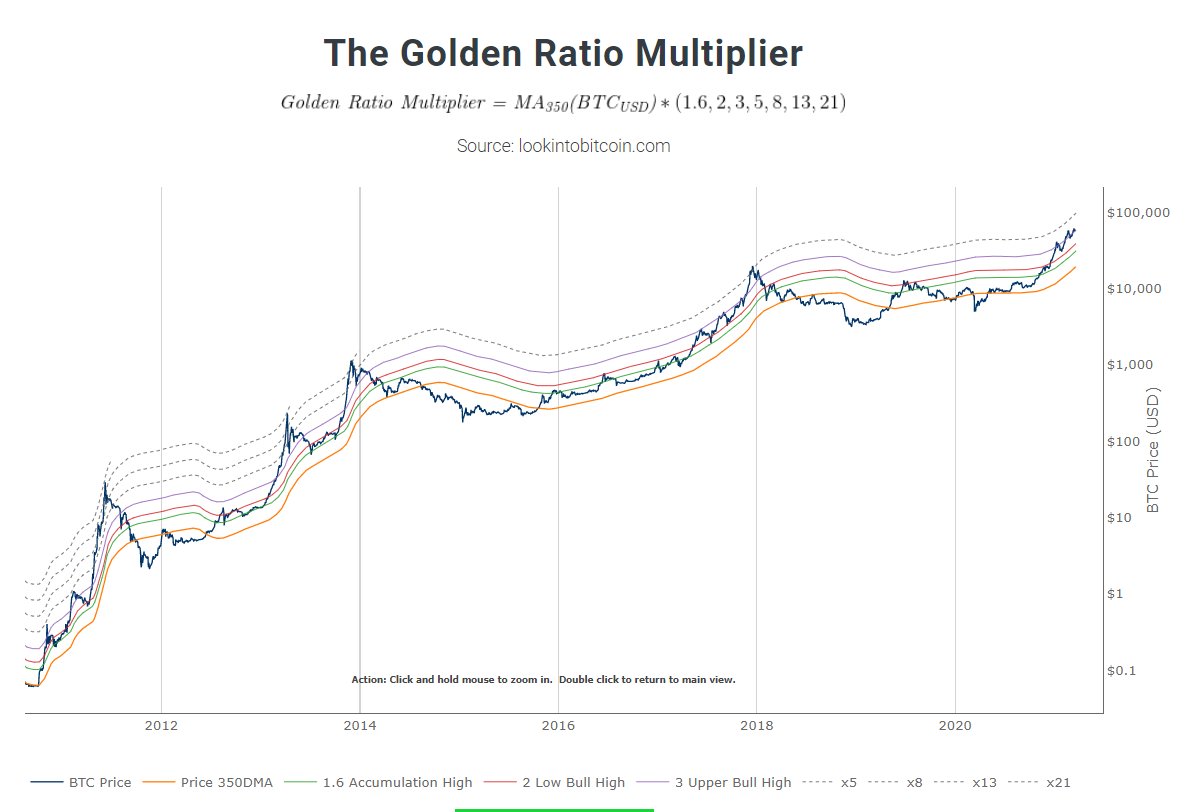
7/ Golden Ratio Multiplier
All in all, the MA-based models are more on the immediate side, late April and price ranges in the $120k region with entering the parabolic phase soon (next two/three weeks)
All in all, the MA-based models are more on the immediate side, late April and price ranges in the $120k region with entering the parabolic phase soon (next two/three weeks)
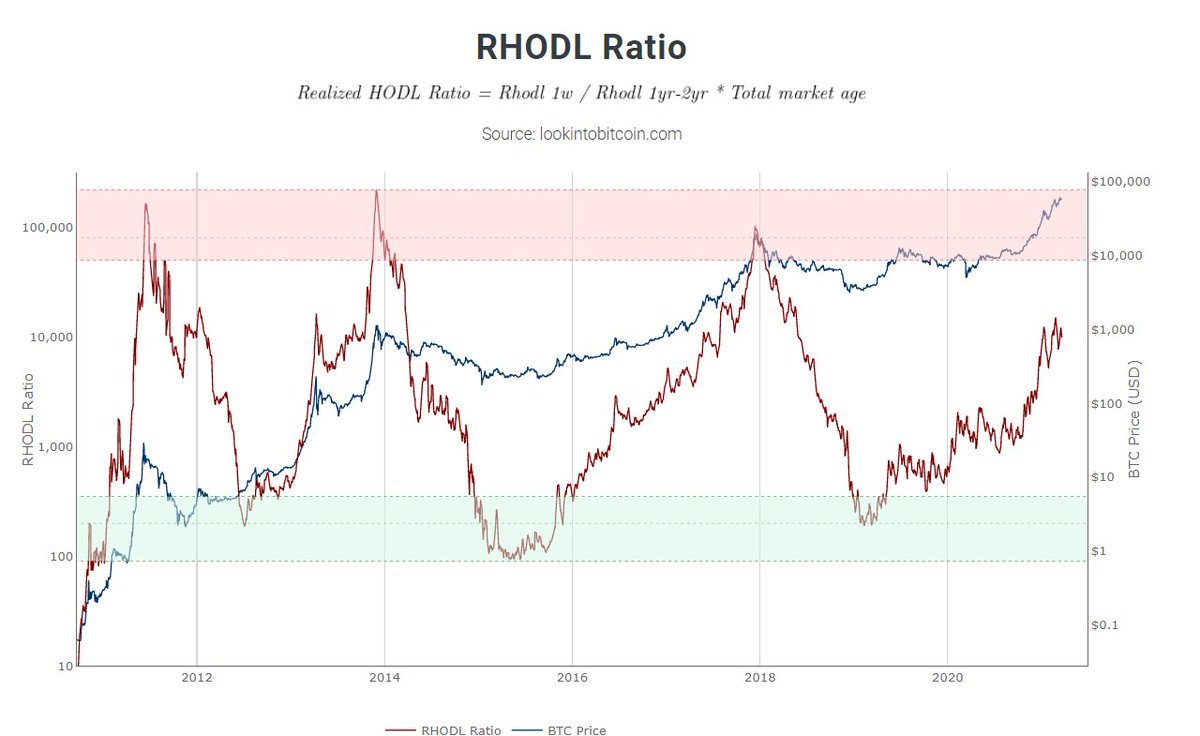
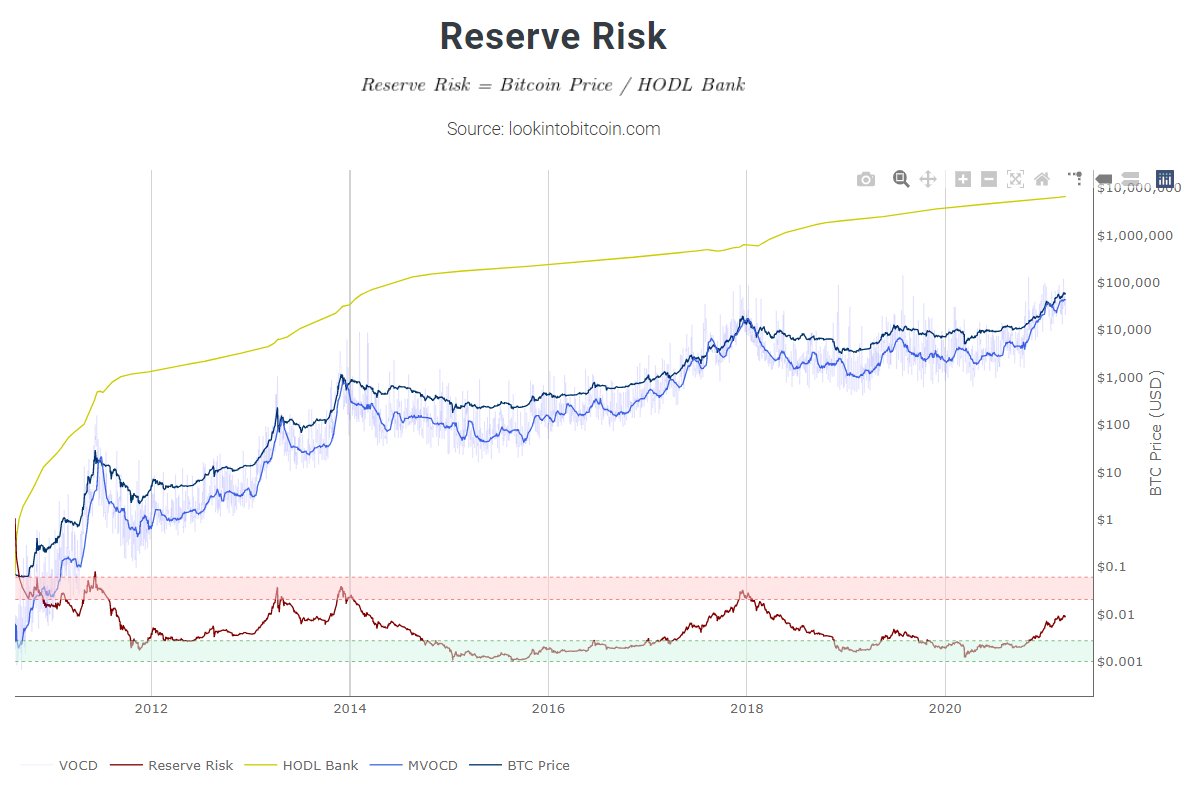
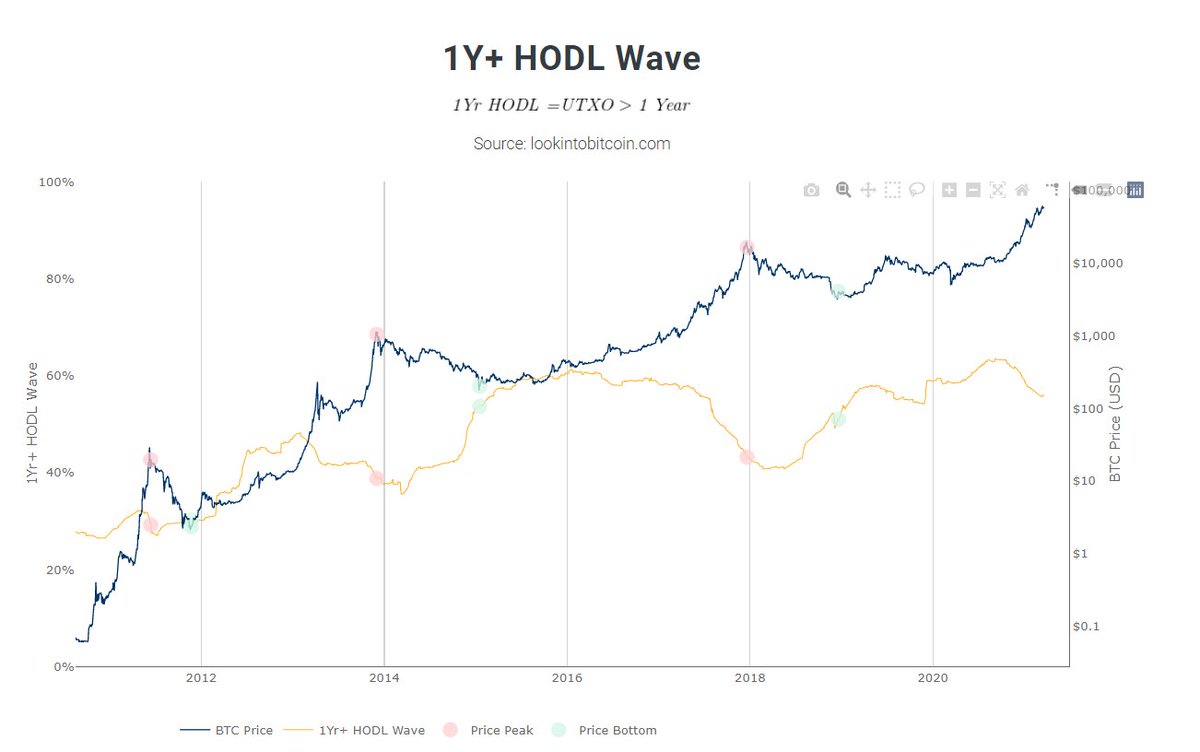
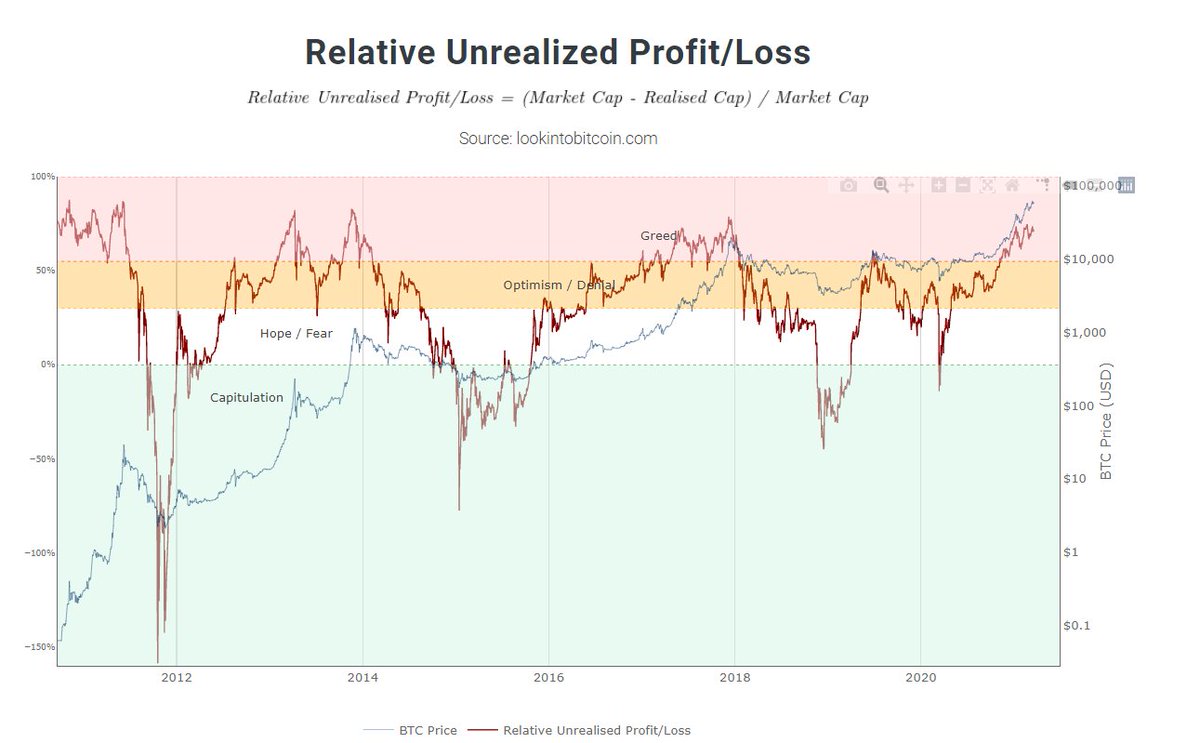
8/ On the other side, many onchain metrics don't show this immediate pressure.
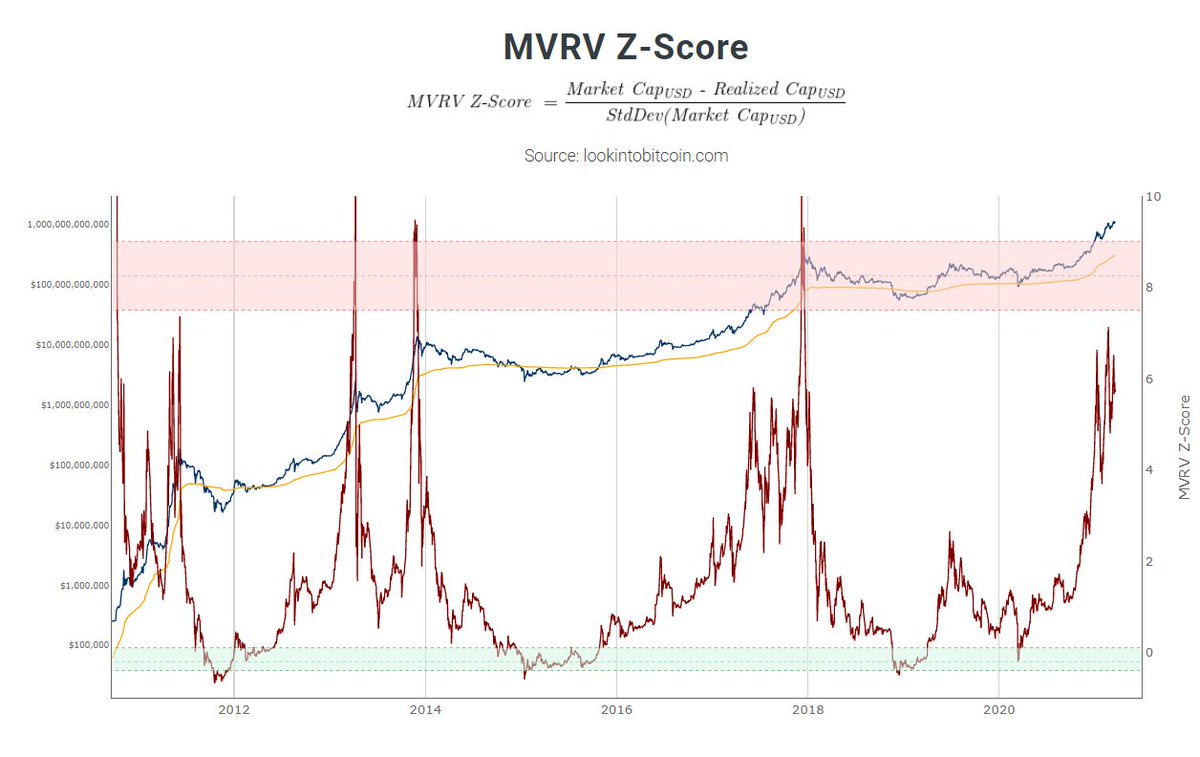
9/ Only this one is flashing red, but as you see, this can be in the greed phase for a longer time.
10/
I recommend reading this.
@Negentropic_ combines both views, arguing that we could see a combination of 2013 and 2017 with a local top coming soon and a global top end of the year.
I recommend reading this.
@Negentropic_ combines both views, arguing that we could see a combination of 2013 and 2017 with a local top coming soon and a global top end of the year.
https://twitter.com/Negentropic_/status/1373333929160286210?s=20
11/ Conclusion
If we see a parabolic acceleration in the near term above $68k, this could take us fast to the $100k- $120k region.
As long as we are printing HLs on the weekly (see my prior posts), anything is possible.
But we have to be cautious.
If we see a parabolic acceleration in the near term above $68k, this could take us fast to the $100k- $120k region.
As long as we are printing HLs on the weekly (see my prior posts), anything is possible.
But we have to be cautious.
12/
No one gets the top. Always manage your risk.
We are already >10x from March 2020 lows.
I'm open to the idea of a cycle combination of 2013/2017.
And last guys, no one can predict this, but its fun playing with it.
Have a nice weekend.
No one gets the top. Always manage your risk.
We are already >10x from March 2020 lows.
I'm open to the idea of a cycle combination of 2013/2017.
And last guys, no one can predict this, but its fun playing with it.
Have a nice weekend.
• • •
Missing some Tweet in this thread? You can try to
force a refresh


