THIS IS VERY IMPORTANT
Couple of days ago we get a Ct table from Madrid Region thru @DaFeid
Once we checked source we used it to analyse data, and the result is clear:
OUR GOV'Ts ARE INTENTIONALLY LYING US
They're telling an epidemic which THEY KNOW is 40% FAKE
Let's see how
Couple of days ago we get a Ct table from Madrid Region thru @DaFeid
Once we checked source we used it to analyse data, and the result is clear:
OUR GOV'Ts ARE INTENTIONALLY LYING US
They're telling an epidemic which THEY KNOW is 40% FAKE
Let's see how

The method.
Original table offers % of PCR+ for Ct <20, >30, and weekly Ct average.
First we deduce % of Ct 21-29. It's easy, the 3 series must add 100%.
We draw a graph with the 3 series, being 21-29 black.
Original table offers % of PCR+ for Ct <20, >30, and weekly Ct average.
First we deduce % of Ct 21-29. It's easy, the 3 series must add 100%.
We draw a graph with the 3 series, being 21-29 black.


Then we use week average to calculate average values for each frame.
We settle all <20 frame to a 20 value. It's the MOST CONSERVATIVE, with bias AGAINST manipulation. It minimises Ct for other 2 frames.
We settle all <20 frame to a 20 value. It's the MOST CONSERVATIVE, with bias AGAINST manipulation. It minimises Ct for other 2 frames.
Then we settle average values for >30 and, using global average, find the resulting average Cts for 21-29 frame
With values under 36 we reach aberrant results, in which 21-29 frame would need to have values over 30 Thus, we settle >30 average value in 36, and graph 21-29 results
With values under 36 we reach aberrant results, in which 21-29 frame would need to have values over 30 Thus, we settle >30 average value in 36, and graph 21-29 results

And now, the lie begins to uncover.
The original graph was given to German @welt journalist @Tim_Roehn as part as an official document
In it, Madrid region explains 100% PCR with Ct<25 are active, 95% with Ct 25-30, and only 21% in CT>35
THE REST ARE OLD INACTIVE INFECTIONS
The original graph was given to German @welt journalist @Tim_Roehn as part as an official document
In it, Madrid region explains 100% PCR with Ct<25 are active, 95% with Ct 25-30, and only 21% in CT>35
THE REST ARE OLD INACTIVE INFECTIONS

We use this fake percentages with all Ct frames, considering their number and estimated Ct, and we find that ~40% Notified cases were FALSE
And they KNOW IT
At epidemic peaks, only 20% is false, but lie grows to 50% when fear pump is needed¬ enough real Epidemic is going on
And they KNOW IT
At epidemic peaks, only 20% is false, but lie grows to 50% when fear pump is needed¬ enough real Epidemic is going on
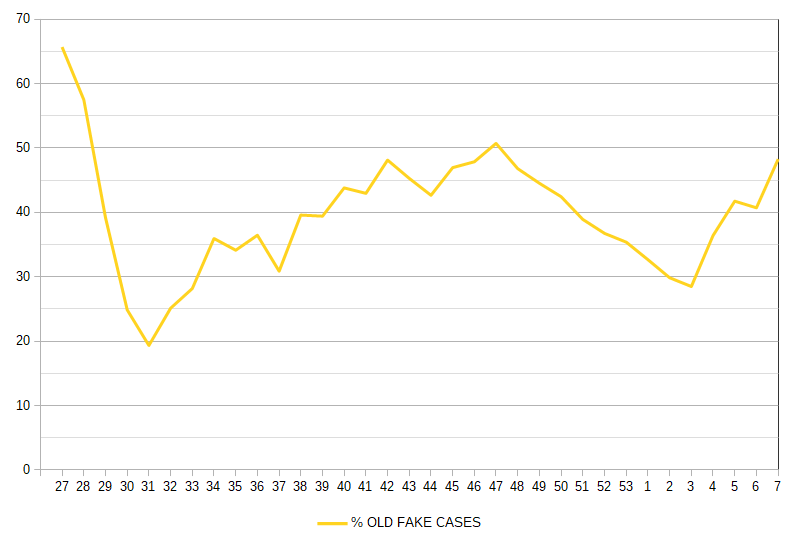
The graph at thread 1st tweet shows true epidemic Vs official.
If we compare true active cases with old fake detection, we notice that around Xmas, CONCERNING Irresponsibles Guilt official Epidemic was 50% FAKE.
USING THEIR OFFICIAL CRITERIA
If we compare true active cases with old fake detection, we notice that around Xmas, CONCERNING Irresponsibles Guilt official Epidemic was 50% FAKE.
USING THEIR OFFICIAL CRITERIA

The number of old non infective cases, that were noted as Covid sick and dangerous Case, was as high as 10K a week!
We repeatedly have spoken about this Fear Machine of PCR inflating thru old infections. Everytime we get access to better series, we find it over and over again.
We repeatedly have spoken about this Fear Machine of PCR inflating thru old infections. Everytime we get access to better series, we find it over and over again.

Finally, as we know weekly TRUE ACTIVE cases, we can calculate Accumulated Incidence at 14 days.
It NEVER went over 700.
The official AI, whose rise is enough to hardly restrict freedoms, went up to 1.000
They KNOW, the document tells!, lots of PCR+ aren't true cases.
They lie
It NEVER went over 700.
The official AI, whose rise is enough to hardly restrict freedoms, went up to 1.000
They KNOW, the document tells!, lots of PCR+ aren't true cases.
They lie


We've reached same result with other methods
We had to develope tools to reach interesting data, cos among the THOUSAND series we're bombed with, there's NEVER good quality test info
It's hidden
Bad luck for'em maths STILL work, even amidst Covid madness
We had to develope tools to reach interesting data, cos among the THOUSAND series we're bombed with, there's NEVER good quality test info
It's hidden
Bad luck for'em maths STILL work, even amidst Covid madness
https://twitter.com/plaforscience/status/1361406716873744385?s=19
I want to remark that 40% fake part of Official Epidemic calculation is the MOST CONSERVATIVE possibility, as we considered ALL <20 frame as CT 20
They SURELY AREN'T.
Fake Epidemic goes EASILY over 50% of Official considering average Ct for <20 frame in plausible values (14-16)
They SURELY AREN'T.
Fake Epidemic goes EASILY over 50% of Official considering average Ct for <20 frame in plausible values (14-16)
• • •
Missing some Tweet in this thread? You can try to
force a refresh