This is @brianwwhitcomb and @ashley_naimi with a short twitter takeover of @AmJEpi about our latest work in the AJE Classroom about ‘noncollapsibility’ #epitwitter
Heard or read about ‘noncollapsibility’, but not sure what it is? Is including nonconfounding risk factors in regression models to estimate causal exposure effects a good or bad idea? Does it even matter?
Answer: IT DEPENDS! Sometimes, adjusting for non-confounding risk factors can lead to very misleading results, making it seem like that factor is a confounder or effect modifier, even though it is not!
How? When? Why? We answer these questions and address these points AND MORE in the AJE Classroom doi.org/10.1093/aje/kw…. Read on for more highlights in this tweetorial!
Let’s start by introducing a simple scenario with a little #DAG with 3 dichotomous variables: disease (D), an exposure of interest (E), and a nonconfounding risk factor (F), which is (marginally) unrelated to E but is a cause of the outcome
Image
The DAG is a nonparametric illustration of a causal system that includes E, F, and D. If we want to estimate the causal effect of E, what we should do about F depends on considerations beyond the DAG. What are these considerations…?
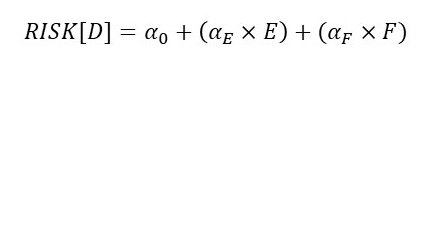
Consideration 1: how do E and F truly affect risk of disease? One possibility is risk additivity. That is, the true effects of E and F are to add to baseline risk. A model to assess additive risk would look like this:
Image
Consideration 2: what model are you using to model disease risk? Two commonly used options are logistic regression (multiplicative odds models) and log-binomial regression (multiplicative risk models)
If disease is truly determined by additive risk then stratification on F in a multiplicative model of odds or risk will make it seem as though F is an effect modifier even though it is not!
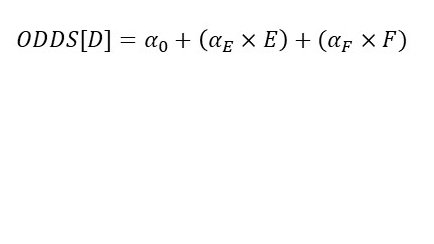
Alternately, E and F could affect disease odds through a multiplicative process, like this:
Image
In this case, NOT INCLUDING nonconfounding factors like F in a logistic regression model results in differences between the adjusted and unadjusted parameter (not estimate!) even though there is no confounding by F!
This is why in 1981, around the time Queen’s “Another one bites the dust” finished a 3 week run on the Billboard Hot 100, Miettenen and Cook wrote “a change in the estimate...as a result of control…can lead to a false conclusion” in @AmJEpi doi.org/10.1093/oxford…
For the rest of the story and consideration of a range of scenarios, check out the full paper in the AJE Classroom doi.org/10.1093/aje/kw…

• • •

Missing some Tweet in this thread? You can try to force a refresh
 

Keep Current with Am J Epidemiology

Am J Epidemiology Profile picture

Stay in touch and get notified when new unrolls are available from this author!

Read all threads

This Thread may be Removed Anytime!

PDF

Twitter may remove this content at anytime! Save it as PDF for later use!

Try unrolling a thread yourself!

how to unroll video
  1. Follow @ThreadReaderApp to mention us!

  2. From a Twitter thread mention us with a keyword "unroll"
@threadreaderapp unroll

Practice here first or read more on our help page!

More from @AmJEpi

23 Apr 20
👋 hi, @LucyStats here! Kicking off some live tweeting of this exciting discussion on the future of epidemiologic methods.

@nondogmatist kicks us off, asking the panelists to discuss what they see in the future of Epi
Starting us off, @edwardsjk and @robertwplatt both talk about *data*

The difference between the “source cohort” or “dark data” and the data that we’re actually using - We often just see the tip of the iceberg 🏔, we need to develop and use methods that take this into account
@robertwplatt states that we need clear actionable questions.

❓➡️ 📈
Make the question drive the method, not the other way around.
Read 25 tweets
2 Jan 20
Happy New Year! To celebrate 2020, how about an #EpiEllie #tweetorial?

Today, let’s talk about e-values and how to interpret them!
E-values were first developed by Tyler Vanderweele and Peng Ding, and is a type of threshold-based quantitative bias analysis.

The original paper introducing the e-value is here: annals.org/aim/article-ab…
But today, I want to talk about a paper from the March 2019 issue of @AmJEpi which calculated e-values for 100 recent papers in each of #nutritionalepi and #environmentalepi, by @l_trinquart, @alerlinger, @JulieMOPetersen, @ProfMattFox, and @sandrogalea

academic.oup.com/aje/article/18…
Read 21 tweets
8 Oct 19
👋 @LucyStats here! Today we’re going to do a little stats primer on testing for non-linear terms when fitting a model.
What do you do when trying to decide whether to include a non-linear term in a model?

1️⃣ test the nonlinear term, if significant leave it in
2️⃣ if you have enough dfs, include the nonlinear term regardless of significance
3️⃣ never include nonlinear terms
4️⃣ comment
It turns out if you make a decision to include the nonlinear term based on a significance test, you are at risk of inflating your Type 1 error 😱

📃 source: onlinelibrary.wiley.com/doi/abs/10.100…
Read 12 tweets
11 Sep 19
Hello #epitwitter! Time for an @epiellie @AmJEpi tweetorial.

Today’s topic is the Target Trial Framework for #causalinference and how to apply it to improving observational studies.

#epiellie
So, what is the #targettrial framework?

Well it’s not a new method! Instead think of it as pedagogical device that provides a structured way to build your research question and study design for observational studies and minimizes the potential for bias.
What does that mean?

To design an observational study, we first think about what the ideal hypothetical randomized trial (target trial) is that would let us answer our research question.

Then, we try to match our observational study as closely as possible to that trial design.
Read 20 tweets
21 Aug 19
The Most Read article in @AmJEpi is a simple, but important, 2013 paper on gun ownership & suicide death in the US.

Critics argue you can’t make cause & effect conclusions based on ecological studies, but is that always true?

Let’s discuss! #epiellie

academic.oup.com/aje/article/17…
So let’s start with some background. What is an ecological study?

It may sound like it’s about the environment, but that’s not really true.

In epidemiology, an ecological study is one where all data about groups not individuals.
What does that mean?

For example, we might know how much chocolate per capita is eaten in countries around the world and we might also know how many Nobel Prize winners each country has had.
nejm.org/doi/full/10.10…
Read 25 tweets
12 Aug 19
It’s time for some #cartoonepi & #epiquiz fun!

Today, let’s talk about Difference-in-Difference analyses and how to use them to estimate the impact of policy changes!

Our example paper is from our May issue by @DrRitaHamad & colleagues.

#epiellie
I love this paper by @DrRitaHamad which tries to answer the question: did updating the allowed contents of the WIC package to include healthier options actually impact diet & nutrition during pregnancy?

Link👇🏼academic.oup.com/aje/article-ab…
First, some background for those of you not familiar with the WIC program.

WIC stands for “Special Supplemental Nutrition Program for Women, Infants, and Children”, and provides vouchers for specific food combos (‘packets’) for low-income pregnant women & kids <5yo in the US.
Read 22 tweets

Did Thread Reader help you today?

Support us! We are indie developers!


This site is made by just two indie developers on a laptop doing marketing, support and development! Read more about the story.

Become a Premium Member ($3/month or $30/year) and get exclusive features!

Become Premium

Too expensive? Make a small donation by buying us coffee ($5) or help with server cost ($10)

Donate via Paypal Become our Patreon

Thank you for your support!

Follow Us on Twitter!