Happy New Year! To celebrate 2020, how about an #EpiEllie #tweetorial?
Today, let’s talk about e-values and how to interpret them!
Today, let’s talk about e-values and how to interpret them!

E-values were first developed by Tyler Vanderweele and Peng Ding, and is a type of threshold-based quantitative bias analysis.
The original paper introducing the e-value is here: annals.org/aim/article-ab…
The original paper introducing the e-value is here: annals.org/aim/article-ab…
But today, I want to talk about a paper from the March 2019 issue of @AmJEpi which calculated e-values for 100 recent papers in each of #nutritionalepi and #environmentalepi, by @l_trinquart, @alerlinger, @JulieMOPetersen, @ProfMattFox, and @sandrogalea
academic.oup.com/aje/article/18…
academic.oup.com/aje/article/18…
This paper sound familiar? You might have heard it discussed on Episodes 2 and 4 of @casualinfer! If not, head over there to have a listen 😄📻
Okay, so what is an e-value all about? An e-value, or “evidence value”, is a way to assessing how much unknown information it would take to have calculated the numeric association you got if there was really no true relationship between your exposure and outcome.
Let’s look at that on a causal graph.
Say we are interested in the effect of diet on health or on the effect of air pollution on health (the 2 types of studies assessed in the paper by @l_trinquart & colleagues).
Say we are interested in the effect of diet on health or on the effect of air pollution on health (the 2 types of studies assessed in the paper by @l_trinquart & colleagues).
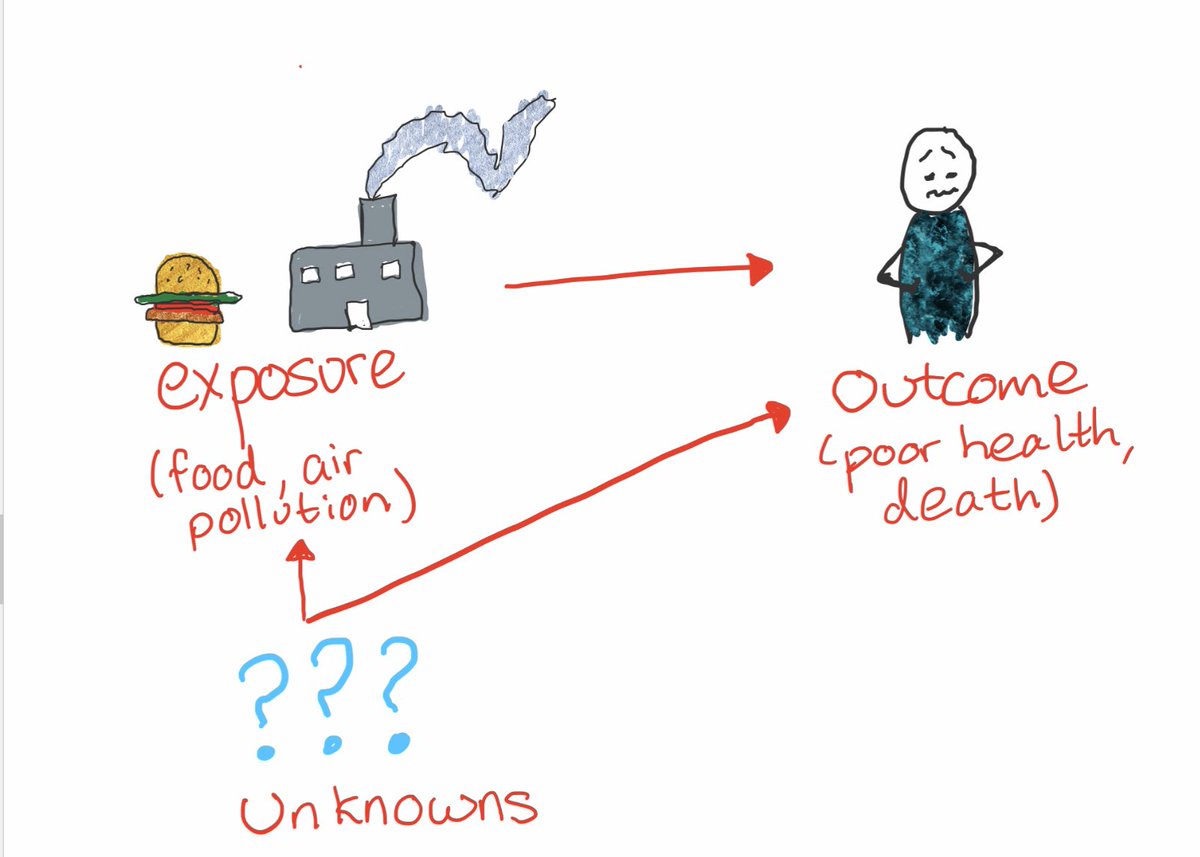
Say we find an association, eg more air pollution —> worse health. The e-value gives us a way to ask: “how strong would relationships between unknown factors and both the exposure *and* outcome have to be to create the association we saw in the absence of a real causal effect?”

As a general rule of thumb, a bigger e-value means it takes *more* missing information to explain away our findings. This is often interpreted as stronger evidence for a true effect.
But the paper by @l_trinquart & colleagues is a good example of why that’s not always true!
But the paper by @l_trinquart & colleagues is a good example of why that’s not always true!
We can calculate the e-value for any study but it doesn’t *mean* that our results are wrong. It also doesn’t tell us anything about how likely these unknown factors are to exist, or whether there might instead (or also) be unknown factors which are *hiding a larger* true effect.
How do we actually calculate the e-value? That depends on what measure of effect we’ve used.
Note, I say measure of *effect* not measure of *association* because we only really care about confounding (those pesky unknowns) when we’re trying to estimate a causal effect!
Note, I say measure of *effect* not measure of *association* because we only really care about confounding (those pesky unknowns) when we’re trying to estimate a causal effect!

Okay, back to the calculation: @l_trinquart & colleagues use the following formulae, which all calculate e-values but vary depending on both how common or rare the outcome is and which measure of effect you’re using.
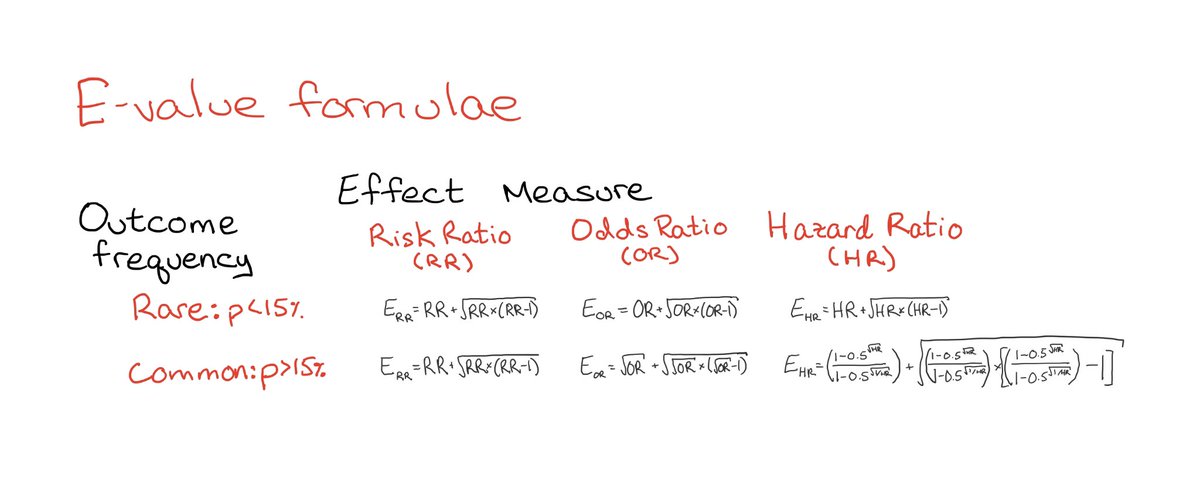
The simplest case is the risk ratio (RR), which always uses the e-value formula regardless of outcome frequency:
E = RR + sqrt(RR * (RR-1))
E = RR + sqrt(RR * (RR-1))

One consequence of these e-value formulae is that the e-value will always be larger for a larger effect size.
This makes sense—a bigger estimate *does seem* harder to explain by unknowns.
(ps do you like my custom gif?👇🏼-@epiellie)
This makes sense—a bigger estimate *does seem* harder to explain by unknowns.
(ps do you like my custom gif?👇🏼-@epiellie)
But wait! It’s not that simple! As @l_trinquart and colleagues remind us, if we want to look at e-values across whole disciplines we have to remember about publication bias!
(Also FYI, descendants of a collider operate with the same DAG rules as colliders!👇🏼p-value is opened!)
(Also FYI, descendants of a collider operate with the same DAG rules as colliders!👇🏼p-value is opened!)
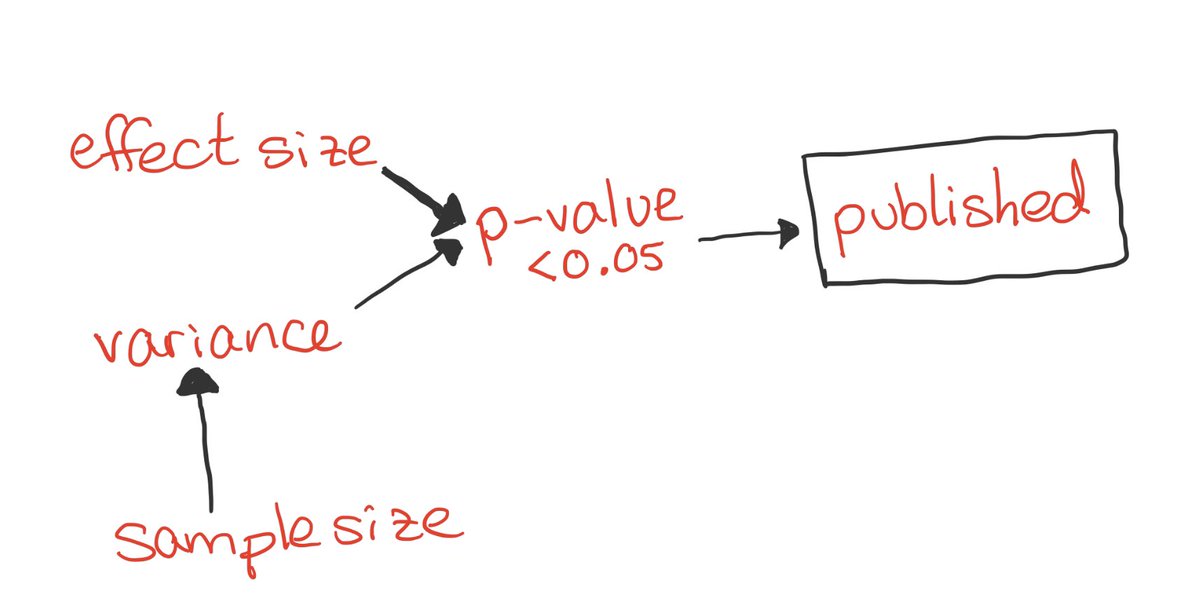
Statistically significant studies are more likely to be published (you might not like it, but it’s often true!).
Statistical significance is likely even for small effects if the sample size is large, but only for large effects when the sample size is small!
Statistical significance is likely even for small effects if the sample size is large, but only for large effects when the sample size is small!

Why does this matter? Well, if we look at a selection of *published* studies in nutritional epi and air pollution epi then we expect whichever field has *smaller* average study populations to have *larger* average effect estimate sizes!
And, thus to have *larger* e-values!
And, thus to have *larger* e-values!

And this is exactly what @l_trinquart and colleagues found!
Studies of air pollution had bigger sample sizes than studies of nutrition—over 20,000 more participants on average!!
Studies of air pollution had bigger sample sizes than studies of nutrition—over 20,000 more participants on average!!
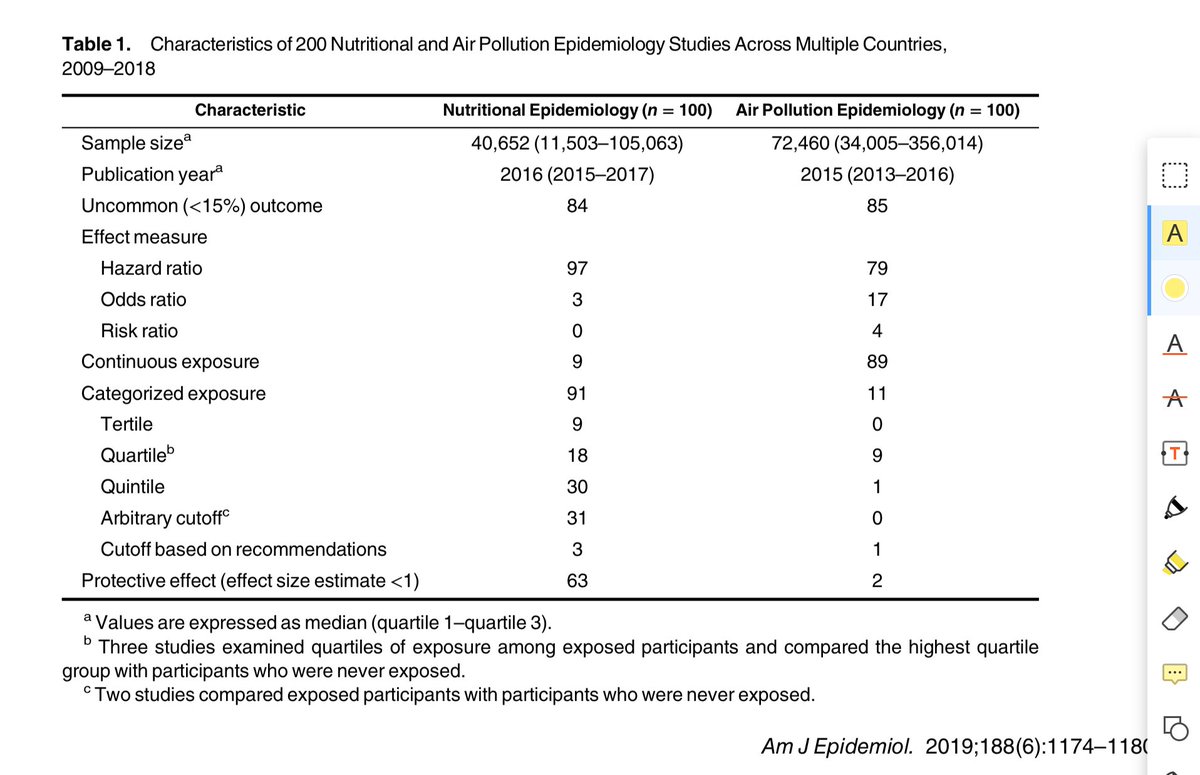
Not surprisingly then, since they were only looking at published studies with statistically significant estimates, the average effect size in the (smaller) nutrition studies was larger than in the average effect size in the (bigger) air pollution studies.

The result? Nutritional epi had higher e-values than air pollution epi!

Does that mean nutritional epi studies *really* give more evidence for true effects than air pollution epi studies?
(Expand to vote in poll!)
(Expand to vote in poll!)
I’ll let you mull on that for today. Discuss your thoughts, read the paper, and listen to the podcast (@casualinfer episodes 2 & 4) if you’re not sure of the answer.
I’ll be in the comments to help you think through it!
I’ll be in the comments to help you think through it!