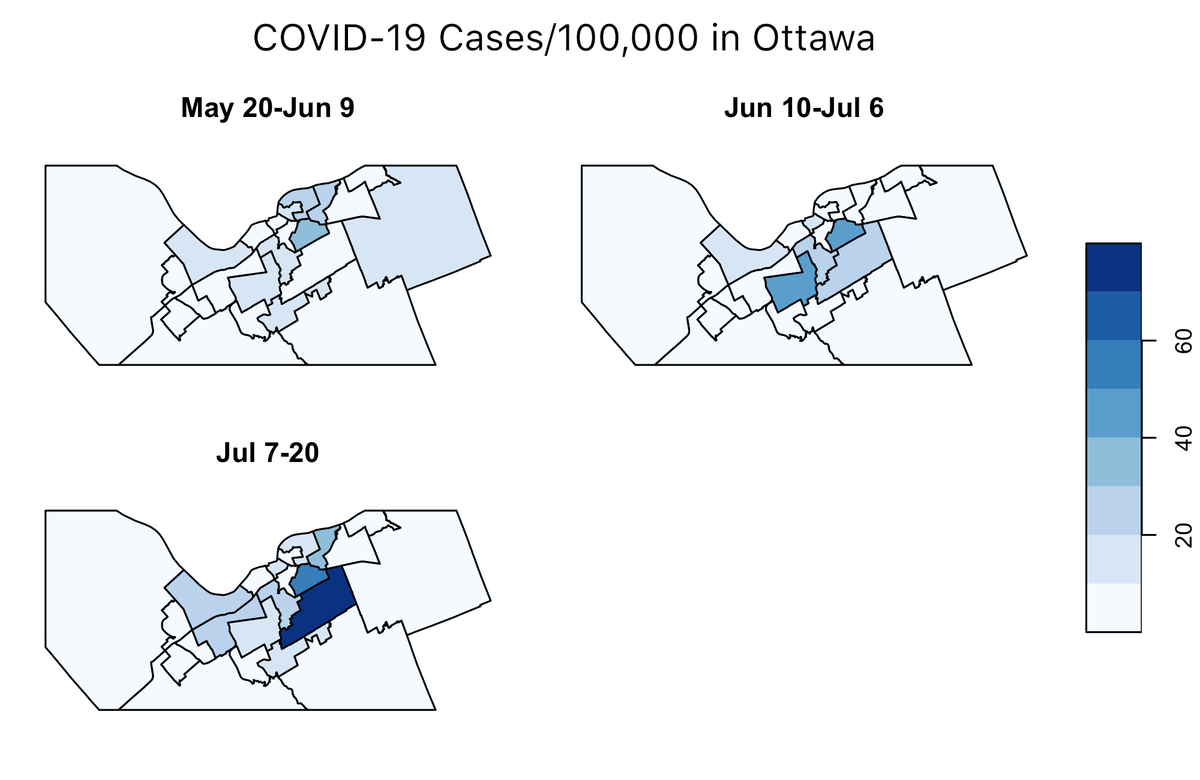
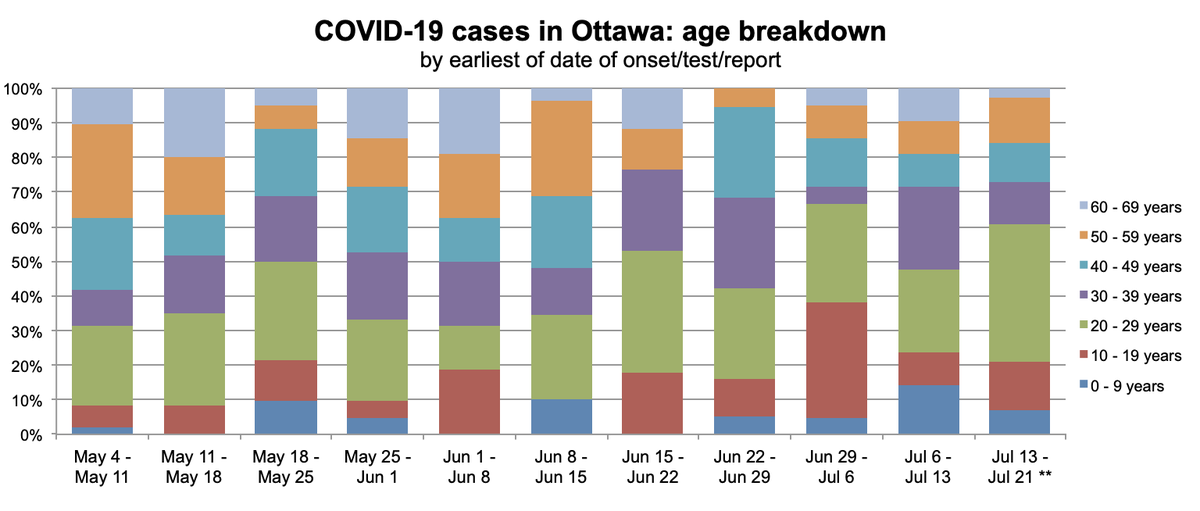
1/ Looking at cross-border #Covid19 data, to shine some light in our data blind spots.
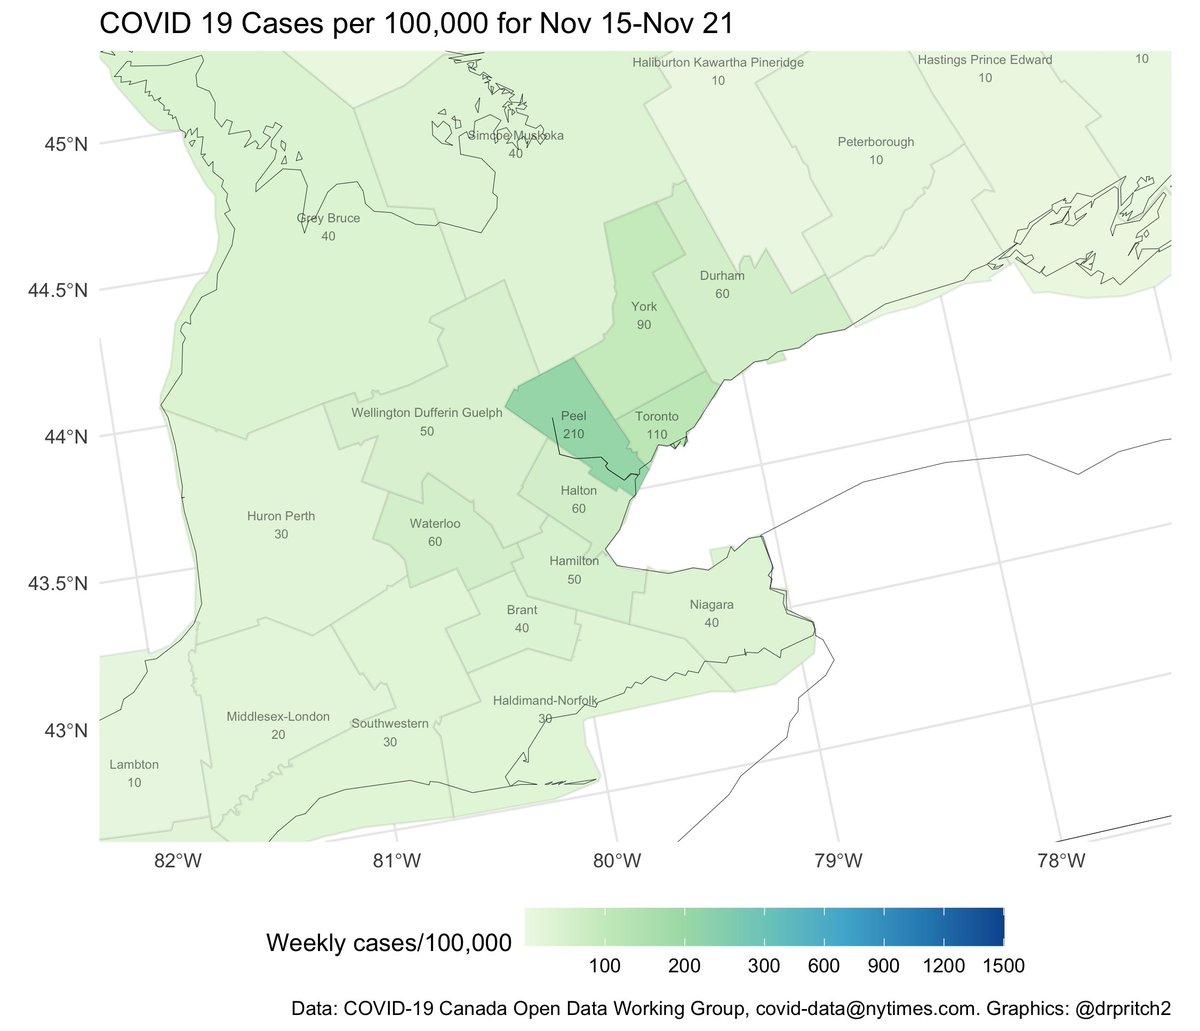
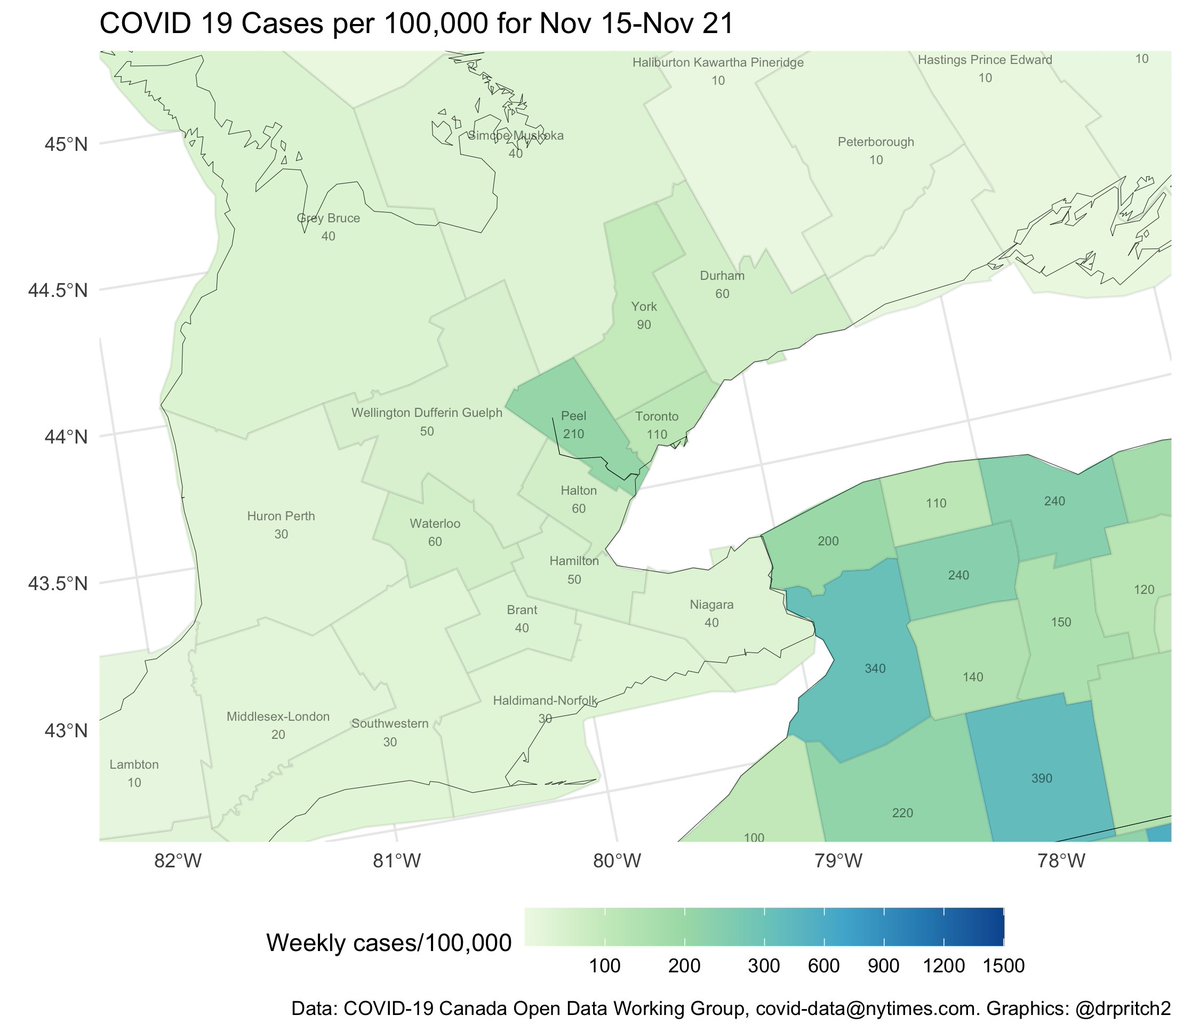
Greater Toronto is back near its January peak. Like then, there are two peak points: Buffalo and Peel. 🇺🇸Niagara County and 🇨🇦London are up more than 2x over 2 weeks.
davidpritchard.org/covid/covidUsa…

Greater Toronto is back near its January peak. Like then, there are two peak points: Buffalo and Peel. 🇺🇸Niagara County and 🇨🇦London are up more than 2x over 2 weeks.
davidpritchard.org/covid/covidUsa…


2/ 🇨🇦Sarnia and Windsor are next to a more dire situation, with case rates 6-8x across the 🇺🇸border.
Lake Huron 🇺🇸 counties and metro Detroit are soaring in B117 cases and doubling every 12 days.
The Michigan-Ohio border is striking too; makes this feel driven by MI's policies.

Lake Huron 🇺🇸 counties and metro Detroit are soaring in B117 cases and doubling every 12 days.
The Michigan-Ohio border is striking too; makes this feel driven by MI's policies.


3/ Pulling back, we can see the extent to which Michigan is the leading edge of the third wave, with Metro NYC as the second major cluster.
Interactive map:
davidpritchard.org/covid/covidUsa…

Interactive map:
davidpritchard.org/covid/covidUsa…


4/ Outside Montréal, ⚜️Québec is also seeing really fast growth.
Over the last two weeks: Bas-St-Laurent is up 15x, Québec City up 6x and Gatineau (Outaouais) up 3x.
The Estrie-🇺🇸Vermont border remains at a 10x difference in case rates, but fairly stable.

Over the last two weeks: Bas-St-Laurent is up 15x, Québec City up 6x and Gatineau (Outaouais) up 3x.
The Estrie-🇺🇸Vermont border remains at a 10x difference in case rates, but fairly stable.


5/ In the prairies, the hottest spots are south Saskatchewan and Minnesota. Alberta and Manitoba are cooling down, as are Thunder Bay/Kenora. 


6/ In BC, the growth rate is worrying: a doubling time of 10-12 days. The Greater Vancouver area leads the way, but growth rates are similar across the province. 


7/ At a full Canada/USA view, large geographies are emphasized: high growth in Michigan, Québec City, Minnesota, New York, south Saskatchewan, Gatineau, Vancouver. Buffalo doesn't span a large geography, but its growth is in the same ballpark.
Full maps:
davidpritchard.org/covid/covidUsa…

Full maps:
davidpritchard.org/covid/covidUsa…


8/ We are all going to be hit by B117. High growth regions probably just reflect the first places where that strain is now dominant; growth appears to accelerate at that moment.
https://twitter.com/EdTubb/status/1375887566457733133?s=20
9/ The purpose of this thread is not to alarm or blame, just to help everyone keep up with the cross-border situation, since most maps/datasets cover only one side of the border.
There's a torrent of data, and it's hard to stay abreast.
Explore yourself:
davidpritchard.org/covid/covidUsa…
There's a torrent of data, and it's hard to stay abreast.
Explore yourself:
davidpritchard.org/covid/covidUsa…
• • •
Missing some Tweet in this thread? You can try to
force a refresh


