Daried Pritchting is not here Profile picture
Apr 4, 2021 9 tweets 6 min read
1/ Looking at cross-border #Covid19 data, to shine some light in our data blind spots.

Greater Toronto is back near its January peak. Like then, there are two peak points: Buffalo and Peel. 🇺🇸Niagara County and 🇨🇦London are up more than 2x over 2 weeks.

davidpritchard.org/covid/covidUsa… 2/ 🇨🇦Sarnia and Windsor are next to a more dire situation, with case rates 6-8x across the 🇺🇸border.

Lake Huron 🇺🇸 counties and metro Detroit are soaring in B117 cases and doubling every 12 days.

The Michigan-Ohio border is striking too; makes this feel driven by MI's policies.
Dec 1, 2020 6 tweets 2 min read
1/ Another look at the #Covid19Canada border, with animations.

The prairies: we can see a big buildup in COVID in the US border states (Dakotas, Montana, Minnesota) by early October. Then in early November it snowballs first in Manitoba next to the border. 2/ The current map of the prairie provinces' border. Image
Nov 26, 2020 11 tweets 5 min read
1/ Let's talk about the border, #COVID19canada and #COVID19Ontario.

So many maps stop at the border. And the Canadian metrics (weekly cases/100k, @imgrund) don't align with the US metrics (daily cases/100k). I think we have trouble understanding just how dire the border is. Image 2/ This is what we think about in Ontario right now. Peel: nearly 200 weekly cases/100k population. Toronto: also in lockdown. The rest of the Greater Toronto Hamilton Area, in the 50-110 bracket, above the red "Control" threshold of 40. Image
Jul 30, 2020 7 tweets 4 min read
#COVID19 in #Ottawa this week: the case spike that started two weeks ago has levelled off, at a new higher plateau. Rt is dropping towards 1.0.

But we have three childcare outbreaks and children/teenagers are ~40% of the week's cases. 1/ 
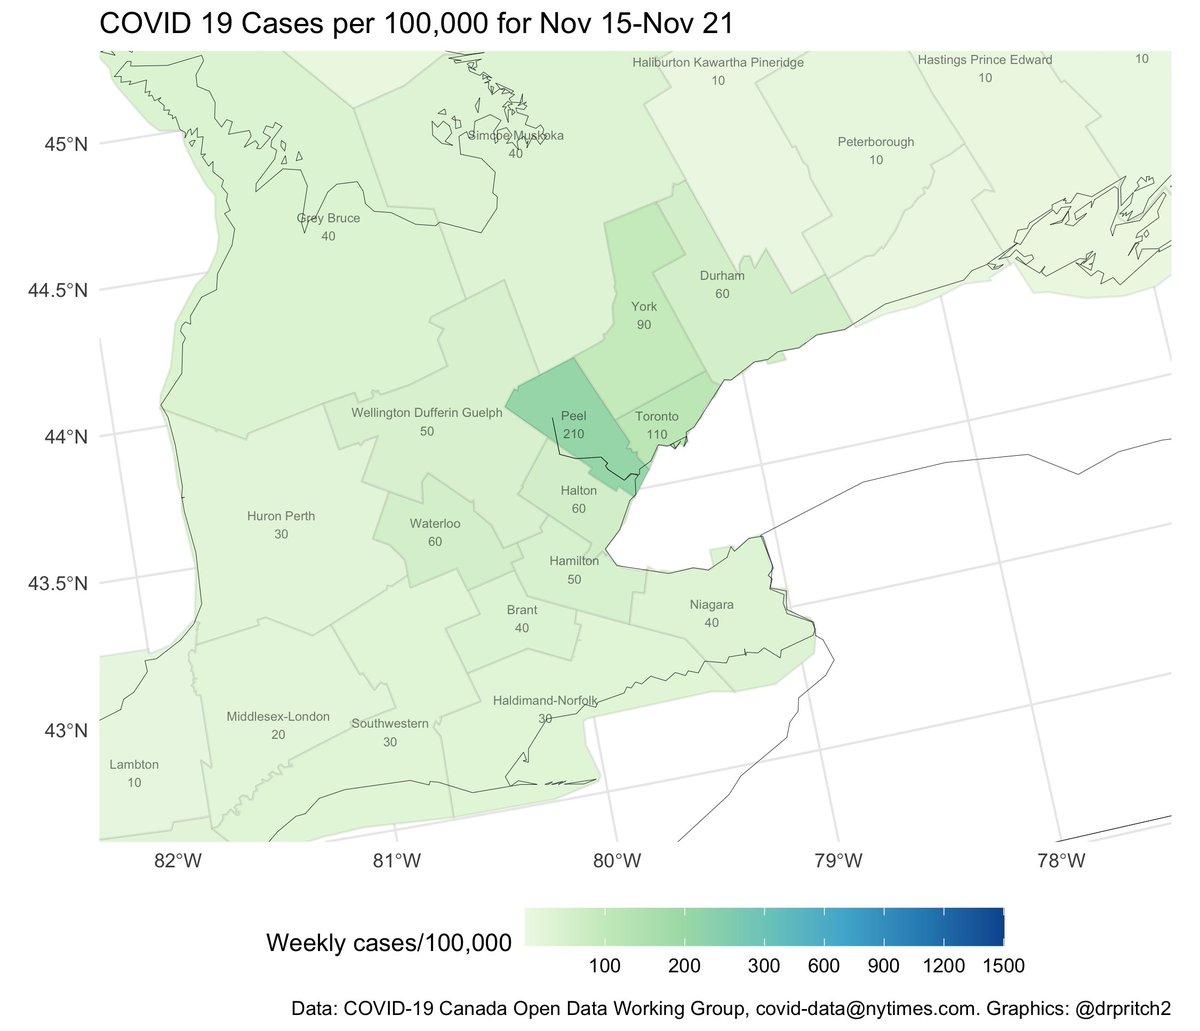
First, the latest COVID19 Rt (reproduction rate) and case graph. 2/
Jul 22, 2020 5 tweets 2 min read
1/ What does the data show about the recent #Ottawa #COVID19 surge?

Geography: while Alta Vista has the highest case rate over the entire epidemic, Ward 10 Gloucester-Southgate appears to be driving the last two weeks of growth. 
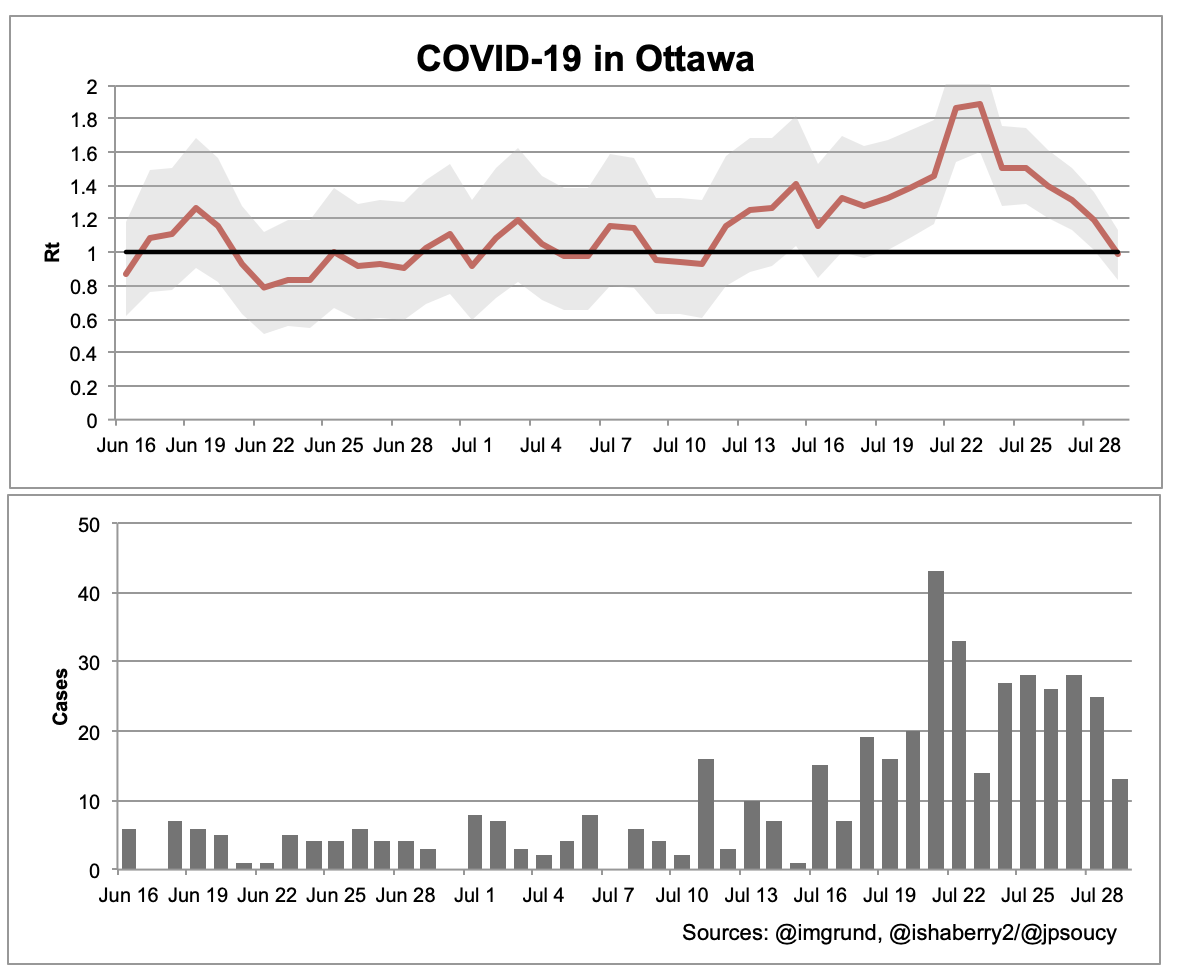
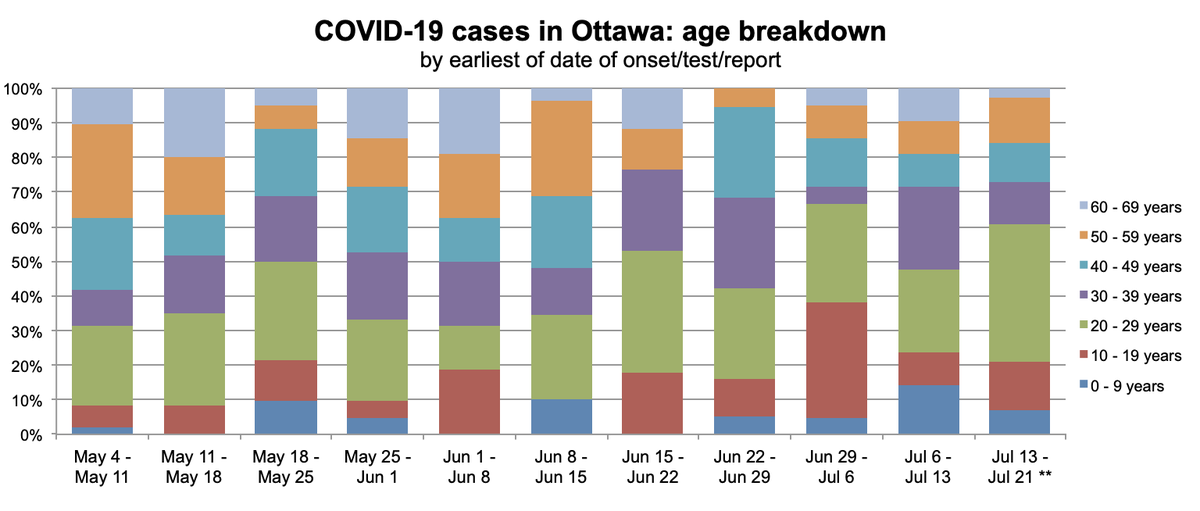
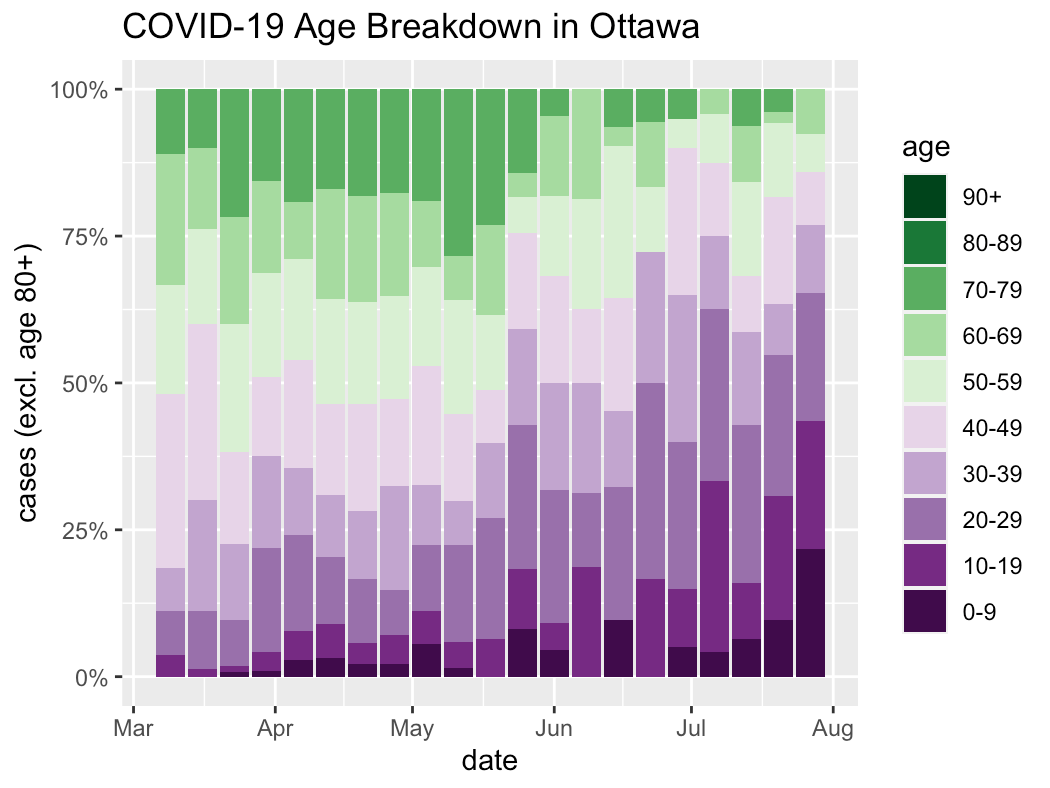
2/ Demographics: @ottawapublichealth hasn't pointed the finger at any single group, just parties and "indoor private gatherings" in general.

The data agrees - apart from a spike in teenage activity at end of June / Canada Day weekend, and a 20s spike in the last week.