Babak Profile picture
7 Apr, 4 tweets, 2 min read
Checking in with the options market, the very LT trend remains clearly bullish (all major MAs in sustained synchronized downtrend): Image
While the market has accelerated higher, the short term standardized equity put/call ratio remains surprisingly neutral(ish): Image
The only recent bullish option signal I noticed was from ISEE's Call/Put ratio which opened up a significant gap between its 10d MA vs 50d MA (see below). This was similar to late October 2020: Image
FWIW there was also this from @MacroCharts on the net put value traded relative to market cap: Image

• • •

Missing some Tweet in this thread? You can try to force a refresh
 

Keep Current with Babak

Babak Profile picture

Stay in touch and get notified when new unrolls are available from this author!

Read all threads

This Thread may be Removed Anytime!

PDF

Twitter may remove this content at anytime! Save it as PDF for later use!

Try unrolling a thread yourself!

how to unroll video
  1. Follow @ThreadReaderApp to mention us!

  2. From a Twitter thread mention us with a keyword "unroll"
@threadreaderapp unroll

Practice here first or read more on our help page!

More from @TN

8 Apr
Quick look at a few #sentiment charts:

Investor Intelligence newsletter sentiment metric continues to recover with bulls 60.8% (+6.4%), bears 16.7% (-.8%) and the correction camp at 22.5% (-5.6%)

chart via @WillieDelwiche Image
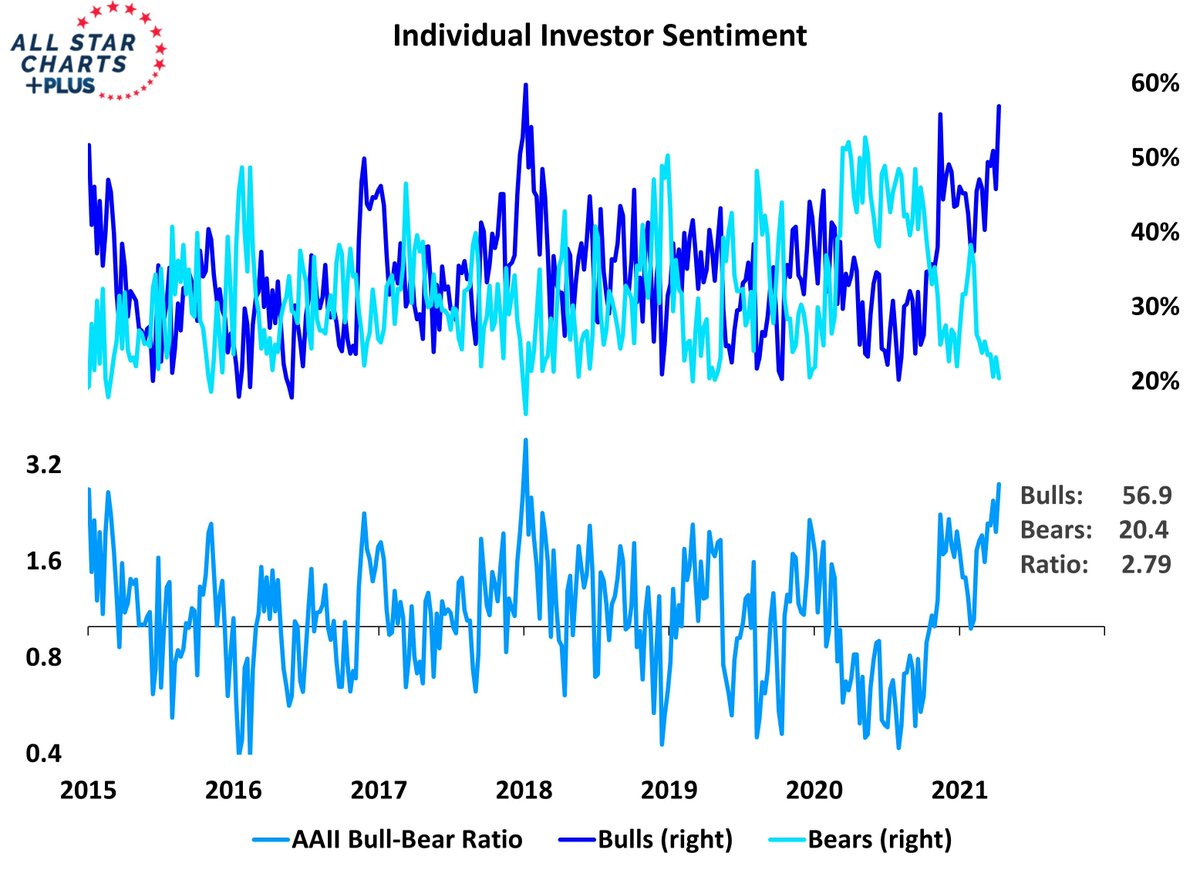
Retail investor #sentiment much more optimistic with those expecting the stock market to continue to rally at the highest levels since January 3rd 2018:

chart via @WillieDelwiche Image
The 4 week MA of bearish AAII respondents is close to a record low as well:

chart via @hmeisler Image
Read 10 tweets
22 Mar
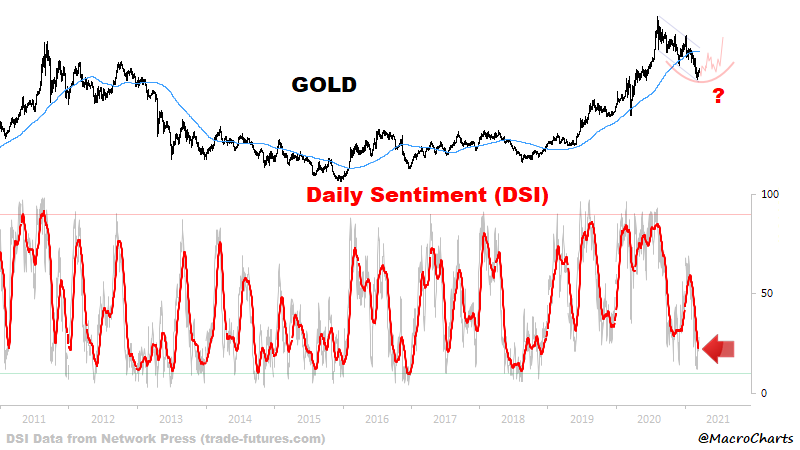
While #sentiment for gold is most definitely depressed and close to historic extremes...

chart via @MacroCharts Image
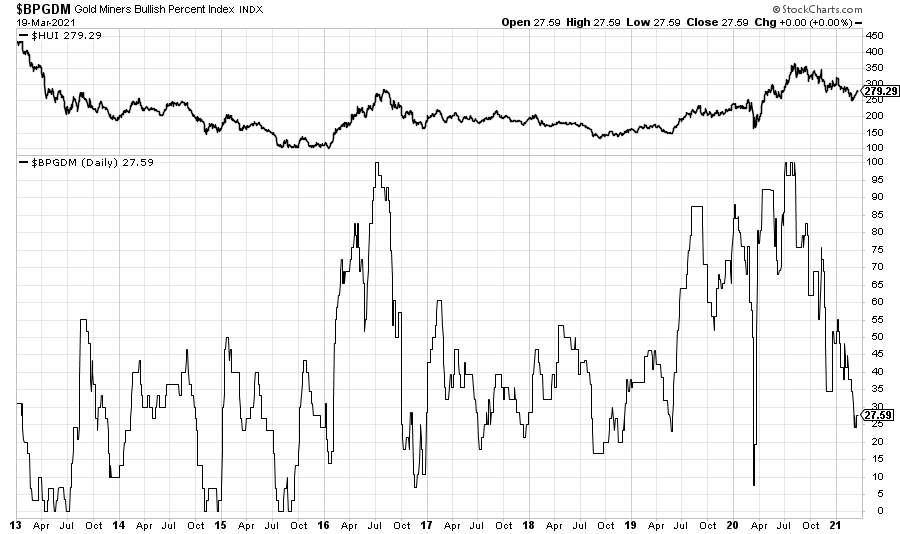
The Bullish Percent index for the gold miners/equity sector is not as extreme: Image
Here's another breadth metric, the percent above 200EMA. It fell to almost 10% on Mar 8th and since then it has bounced strongly: Image
Read 5 tweets
7 Mar
The view from 30,000 ft... a very long term chart of stock market #valuation (via 3Edge): S&P 500 Market Valuation 19...
Similar, but slightly different #valuation gauge from Bridgewater: US Equity Price Gauge Perce...
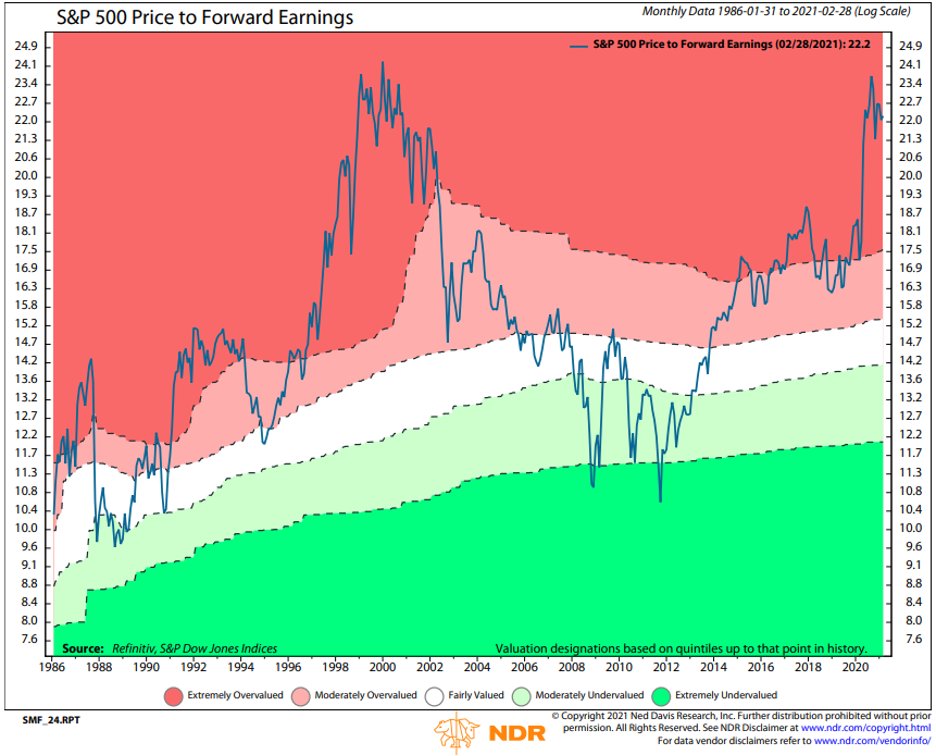
S&P 500 Price to Forward Earnings Ratio remains below its pre-pandemic highs but still very stretched historically #valuation

via NDR h/t CMG S&P 500 Price to Forward Ea...
Read 5 tweets
24 Oct 19
Lowry Research 1/7:

"the forces of Supply and Demand suggest the market is consolidating its gains from the Dec 24 2018 and June 4 2019 lows through this sideways trading rather than forming a significant topping pattern."

edgeandodds.com/smart-investin…
Lowry Research 2/7:

"Thus, the probabilities are this period of consolidation will be resolved to the upside through a rally that carries to new all-time highs. (…) Historically, breadth tends to lead price in moving to new highs."
Lowry Research 3/7:

"Thus, if precedent holds, the new highs in the various Adv-Dec Lines reinforce the probabilities the market’s current sideways movement will be followed by a rally that carries the major price indexes to new highs in the months ahead.”
Read 8 tweets

Did Thread Reader help you today?

Support us! We are indie developers!


This site is made by just two indie developers on a laptop doing marketing, support and development! Read more about the story.

Become a Premium Member ($3/month or $30/year) and get exclusive features!

Become Premium

Too expensive? Make a small donation by buying us coffee ($5) or help with server cost ($10)

Donate via Paypal Become our Patreon

Thank you for your support!

Follow Us on Twitter!