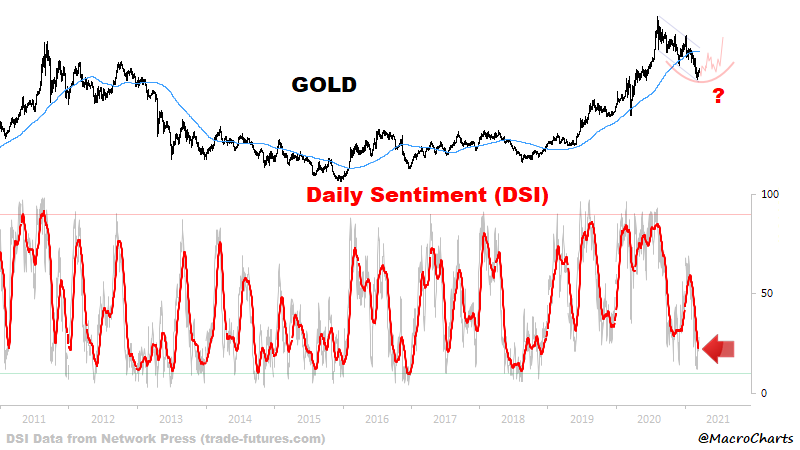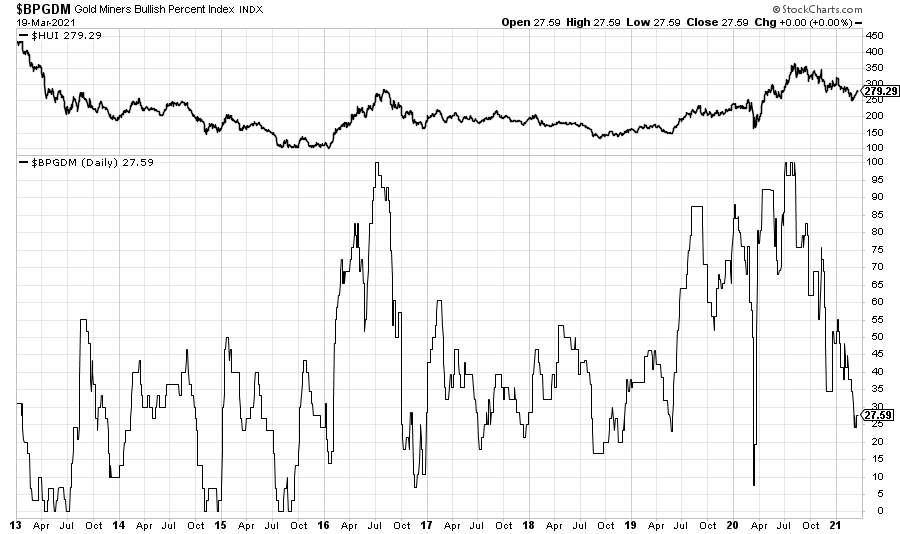
While #sentiment for gold is most definitely depressed and close to historic extremes...
chart via @MacroCharts
chart via @MacroCharts

Here's another breadth metric, the percent above 200EMA. It fell to almost 10% on Mar 8th and since then it has bounced strongly: 

The Hulbert Gold Newsletter #Sentiment Index tracking the long/short recommendation of stock newsletters focusing on precious metals fell to an extremely pessimistic level earlier this month:
thestreet.com/investing/gold…
thestreet.com/investing/gold…

FYI: Hulbert Gold Newsletter Sentiment Index has recovered from its recent extreme pessimistic depths (see above) but remains relatively low at ~22%.
IOW gold timing newsletters tracked are on average recommending -22% short exposure to #gold.
$GLD $HUI $XAU #contrarian
IOW gold timing newsletters tracked are on average recommending -22% short exposure to #gold.
$GLD $HUI $XAU #contrarian
• • •
Missing some Tweet in this thread? You can try to
force a refresh


