We now have data from mass testing in schools for the first 4 weeks after they fully reopened on March 8th, up to the end of the spring term.
The results suggest that transmission of the virus *has* increased since schools went back .. but mostly amongst staff.
The results suggest that transmission of the virus *has* increased since schools went back .. but mostly amongst staff.


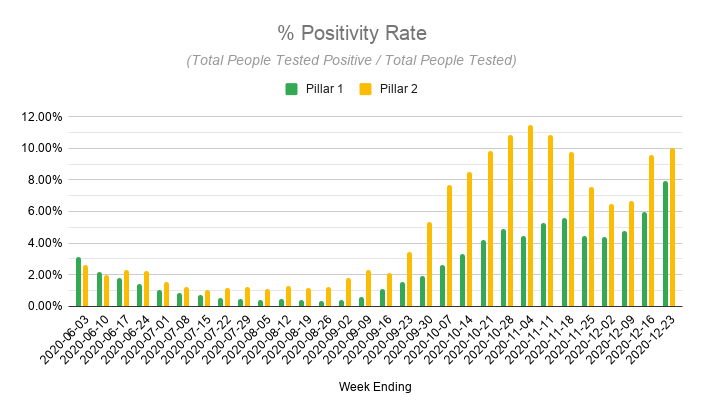
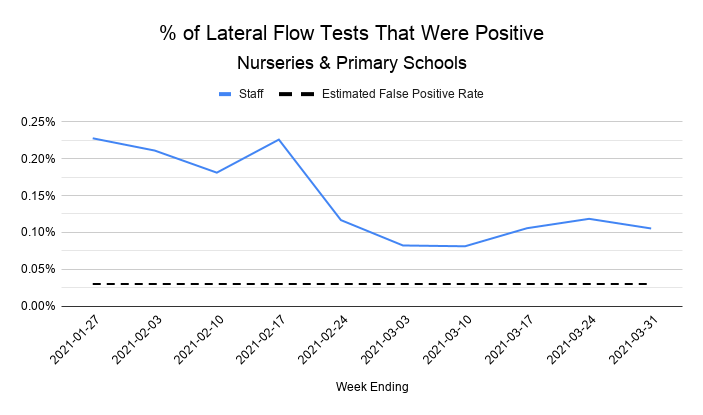
Starting with nurseries and primary schools, the data initially looks rather alarming, with a huge jump in positivity rates the week after schools reopened.
However...
However...

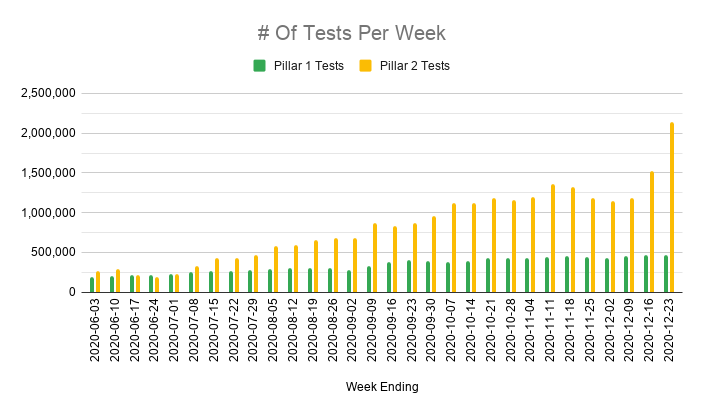
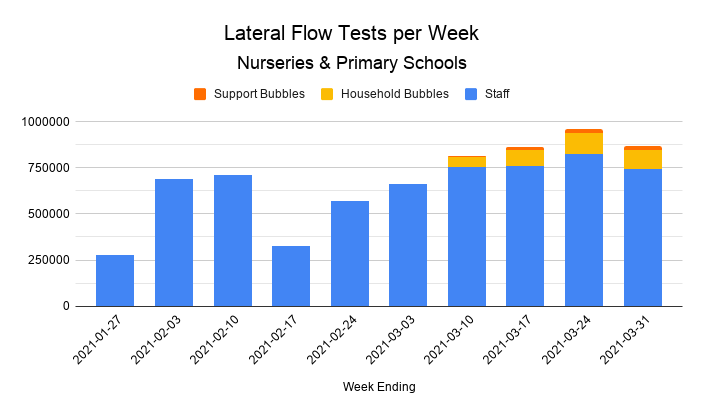
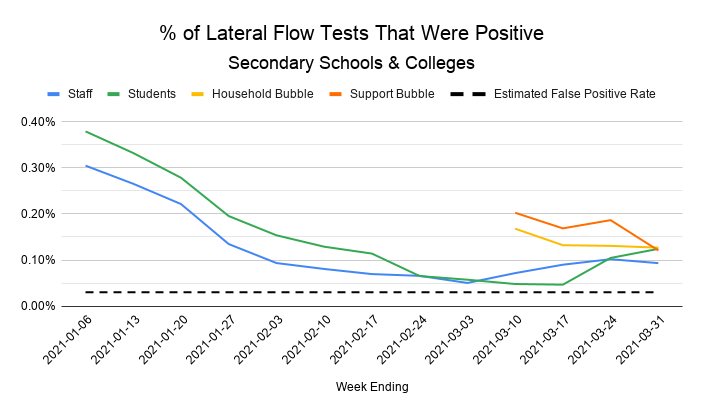
The data is also broken down by role within the school, and we can see that the government started rolling out free lateral flow tests for support and household bubbles to use at home when schools fully reopened.
These are included in the main school test figures!
These are included in the main school test figures!
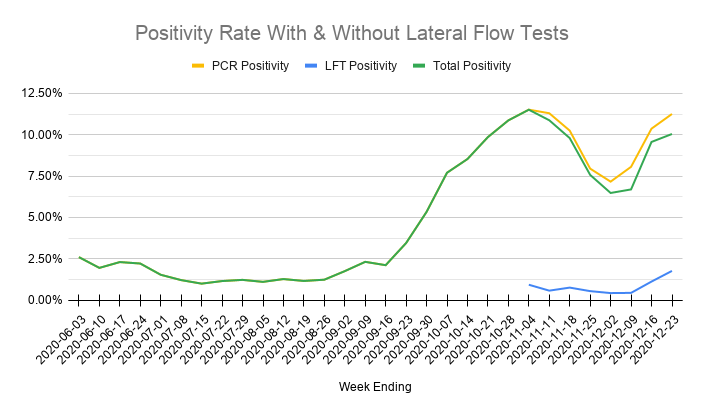
If you break down positivity rates by role, you can see covid rates are MUCH higher in these bubbles.
Some of this may be genuine, and some of it may be selection bias (people with symptoms using the tests, or people being less likely to report negative results than positives).
Some of this may be genuine, and some of it may be selection bias (people with symptoms using the tests, or people being less likely to report negative results than positives).
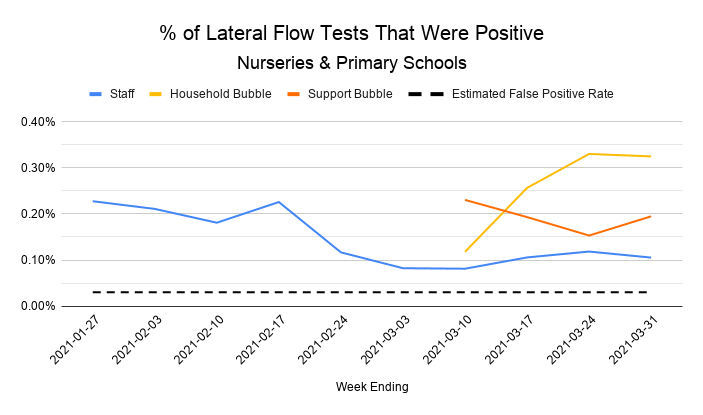
If we focus only on staff, whose testing regimen didn't change during this period as far as I know, we can see the proportion of tests reported positive DID rise though, from 0.08% to 0.12%.
(Ignore the mid-Feb bump - it's an artefact caused by much less testing at half term.)
(Ignore the mid-Feb bump - it's an artefact caused by much less testing at half term.)

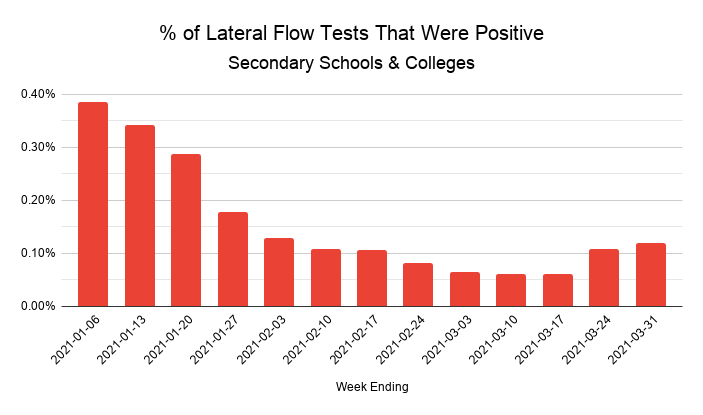
In secondary schools things initially look rather different, with overall positivity rates staying low when schools reopened, before exploding a couple of weeks later.
Again though, this doesn't tell the whole story...
Again though, this doesn't tell the whole story...

Because in secondary schools pupils are also tested, and their numbers completely dwarf all other testing.
The number of tests used jumped from 350,000 to 830,000 a week as the first pupils were tested prior to returning, then to over 4 million a week when their classes started!
The number of tests used jumped from 350,000 to 830,000 a week as the first pupils were tested prior to returning, then to over 4 million a week when their classes started!

Again, if we break the data down by role, we can see that when pupils returned to school they had lower positivity rates than staff.
This masked the fact that positivity rates for staff were already rising the week that schools reopened, before that could have had any impact.
This masked the fact that positivity rates for staff were already rising the week that schools reopened, before that could have had any impact.

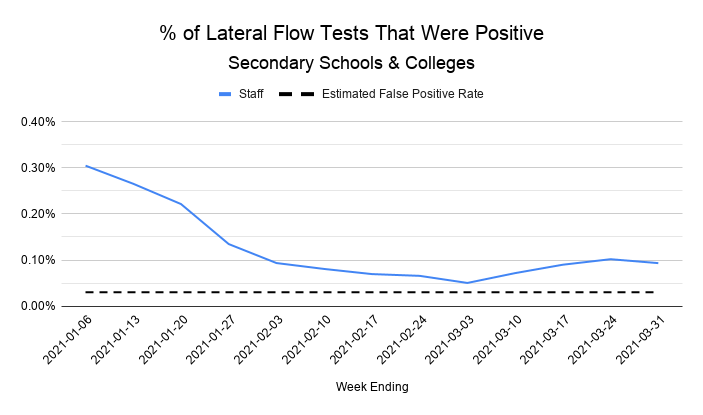
Again, if we focus only on staff, there's a significant rise in positivity rates, from 0.05% to 0.1%.
Positivity was already rising as schools fully reopened, after a February half term dip, and continued climbing for two weeks after millions of children returned to classrooms.
Positivity was already rising as schools fully reopened, after a February half term dip, and continued climbing for two weeks after millions of children returned to classrooms.
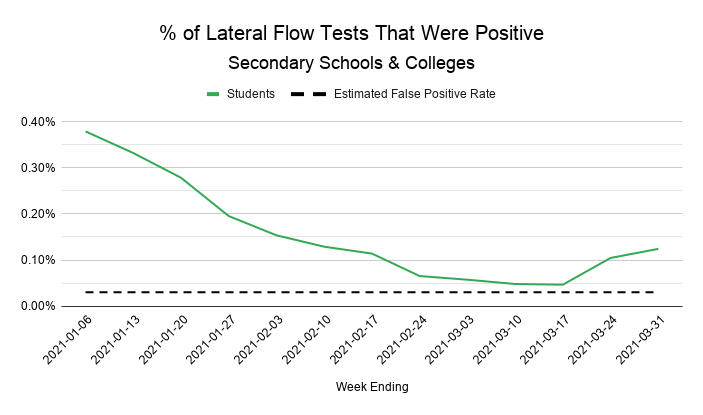
Meanwhile we can see that actually very few children tested positive when they returned to school.
Positivity bottomed out at 0.047%, barely above the lateral flow tests' false positive rate, which is now believed to be 0.03%.
A couple of weeks later though, rates rose rapidly.
Positivity bottomed out at 0.047%, barely above the lateral flow tests' false positive rate, which is now believed to be 0.03%.
A couple of weeks later though, rates rose rapidly.
So is this proof that covid IS spreading amongst children in schools? Unfortunately it's not clear, because testing hasn't been consistent.
When pupils first returned they were tested three times under supervision in school.
After that they started testing themselves at home.
When pupils first returned they were tested three times under supervision in school.
After that they started testing themselves at home.
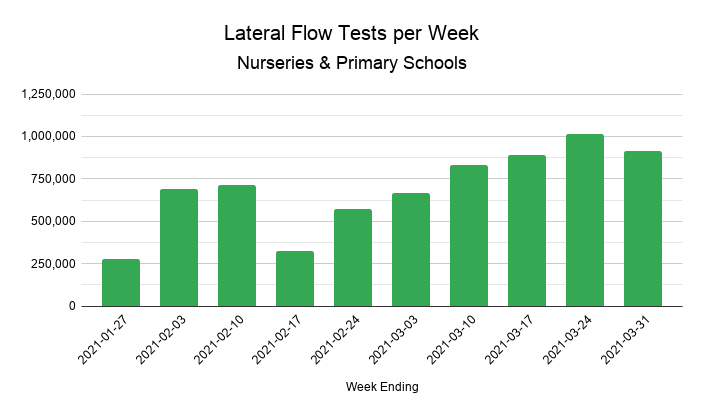
If we go back to the testing data, we can see that the number of test results reported by pupils dropped sharply a week and a half after they returned to school. Just as home testing began.
Either some children stopped using the tests and/or they didn't report all their results.
Either some children stopped using the tests and/or they didn't report all their results.

Either of these could skew positivity rates.
You're more likely to use a home test if you're not feeling well (whereas nobody with symptoms should have gone to school to get tested).
And if you do take a test you're (hopefully) more likely to report the result if it's positive.
You're more likely to use a home test if you're not feeling well (whereas nobody with symptoms should have gone to school to get tested).
And if you do take a test you're (hopefully) more likely to report the result if it's positive.
In fact, even the first round of testing in schools was far from perfect. Although the results were reported, about 12% of tests taken in the first two weeks after schools reopened weren't registered.
Meaning that for over a million tests we have no way of knowing who took them!
Meaning that for over a million tests we have no way of knowing who took them!

The rate for positive tests is a bit lower - 452 positive results (8-9% of the total) weren't properly registered in the first two weeks.
You'd hope these children were still sent home to self-isolate. But even if they were, they may not have been contact traced because of this.
You'd hope these children were still sent home to self-isolate. But even if they were, they may not have been contact traced because of this.

Other issues that may affect the data include:
- Staff who were previously working at home returning to school, increasing their exposure.
- Changes in access to confirmatory PCR testing reducing the number of false positives.
- Whether false positives are more likely at home.
- Staff who were previously working at home returning to school, increasing their exposure.
- Changes in access to confirmatory PCR testing reducing the number of false positives.
- Whether false positives are more likely at home.
This all makes it hard to say for sure what's happening.
Rates amongst staff have definitely risen since schools fully reopened, but levelled out at the end of March.
Rates also seem to have risen in pupils a week or two later, but this might be skewed by changes in testing.
Rates amongst staff have definitely risen since schools fully reopened, but levelled out at the end of March.
Rates also seem to have risen in pupils a week or two later, but this might be skewed by changes in testing.
The good news is that although positivity rates from mass testing in schools have risen significantly since schools fully reopened, they're still very low overall - about 1 in 1,000 at the end of March - and if anything rates amongst staff seem to have levelled off recently.


All of the graphs above are my own, based on data from the Tests Conducted spreadsheet that's released alongside the weekly Test & Trace report.
gov.uk/government/pub…
gov.uk/government/pub…
• • •
Missing some Tweet in this thread? You can try to
force a refresh