#Bitcoin update
1/n
Today: Volatility Analysis.
The next leg up could take us to >100k if volatility dynamics repeat from past cycle.
Thread👇
1/n
Today: Volatility Analysis.
The next leg up could take us to >100k if volatility dynamics repeat from past cycle.
Thread👇
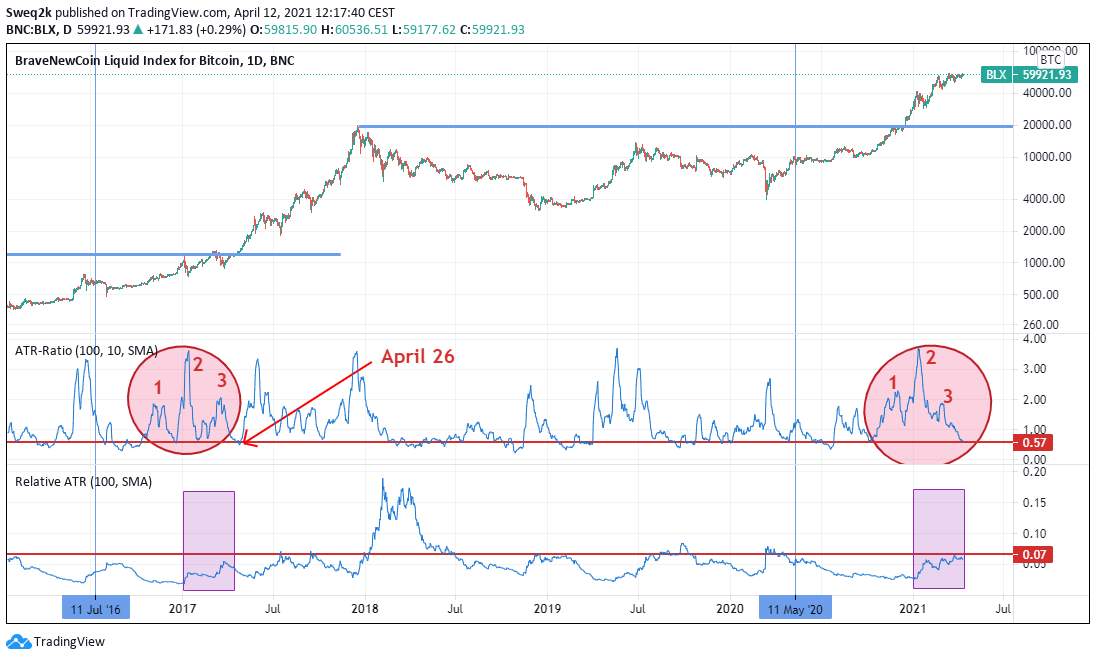
2/n The first indicator "ATR-Ratio" shows the ratio of short term (10 days) to medium term volatility (100 days). Higher values indicate higher volatility then trend and vice versa.
3/n
In early 2017, we have interestingly seen a very similar volatility pattern to the current one, i.e. a pattern with three spikes followed by very low vola until late April. The next move higher in 2017 was over 2x from there.
In early 2017, we have interestingly seen a very similar volatility pattern to the current one, i.e. a pattern with three spikes followed by very low vola until late April. The next move higher in 2017 was over 2x from there.
4/n
The second chart shows the relative ATR in % over 100 days. A hot debate is whether #Bitcoin will see declining returns over time. This is somehow intuitive as with a larger market cap more and more capital is required to move the price - longer term this makes sense.
The second chart shows the relative ATR in % over 100 days. A hot debate is whether #Bitcoin will see declining returns over time. This is somehow intuitive as with a larger market cap more and more capital is required to move the price - longer term this makes sense.
5/n
But do we see this currently? Comparing the current volatility to the last cycle actually shows no decline in volatility. Actually, vola was higher and - no surprise - this cycle has also seen higher returns over the past months.
But do we see this currently? Comparing the current volatility to the last cycle actually shows no decline in volatility. Actually, vola was higher and - no surprise - this cycle has also seen higher returns over the past months.
6/n
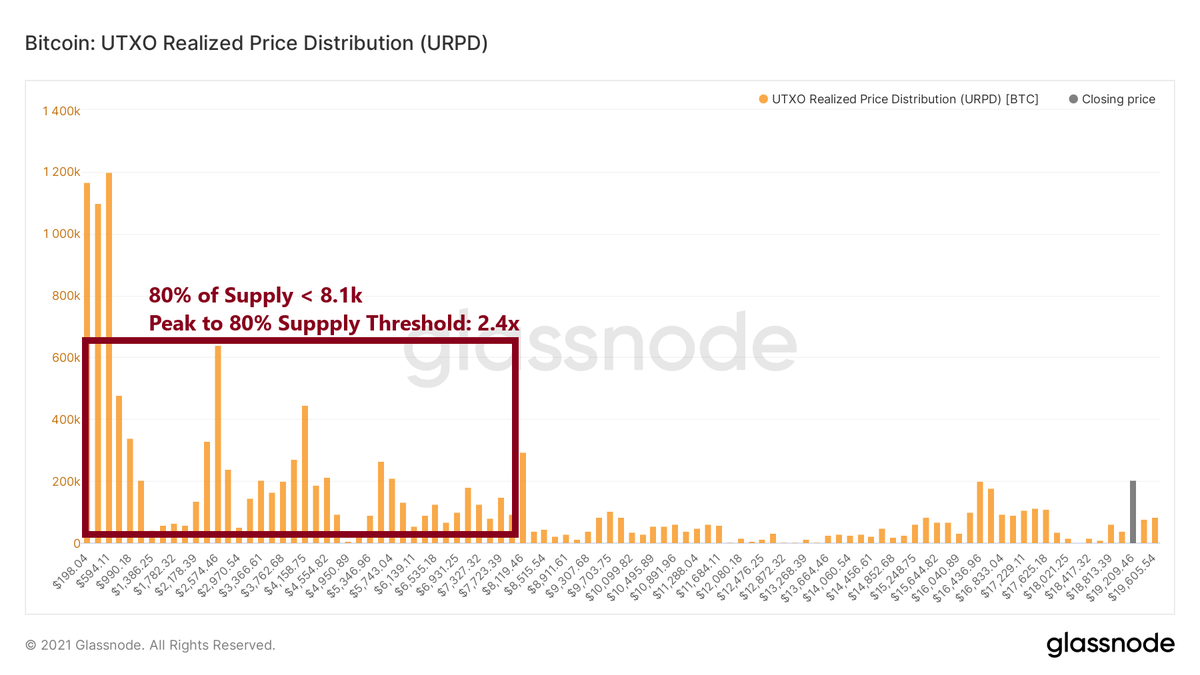
So at least as of now in this cycle there are no signs of "slowing down". The next leg up could happen soon if vola dynamics from the previous cycle are a guide and it could be massive. In 2017 it was over 2.2x until June.
Let's see.
So at least as of now in this cycle there are no signs of "slowing down". The next leg up could happen soon if vola dynamics from the previous cycle are a guide and it could be massive. In 2017 it was over 2.2x until June.
Let's see.
• • •
Missing some Tweet in this thread? You can try to
force a refresh