Types of Models
In Time-Series Data, we have to observe which model fits the nature of the current data.
Two types of Models are:
🔸Additive Models
🔸Multiplicative Models
Let's discuss in brief 👇
In Time-Series Data, we have to observe which model fits the nature of the current data.
Two types of Models are:
🔸Additive Models
🔸Multiplicative Models
Let's discuss in brief 👇
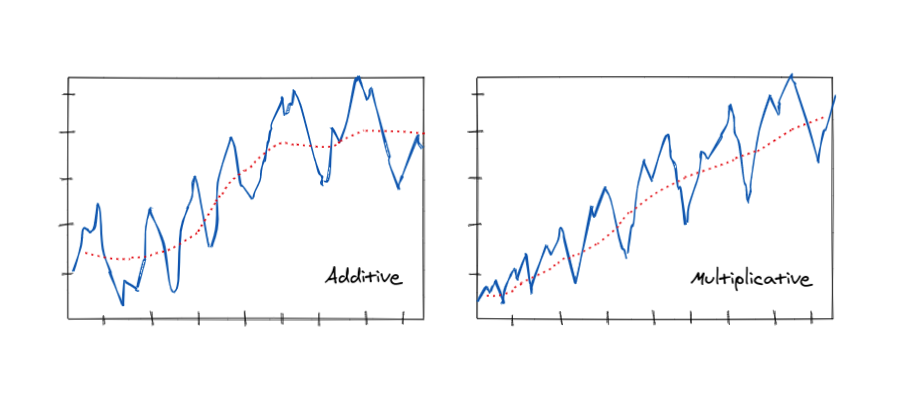
ADDITIVE MODELS
🔹Synthetically it is a model of data in which the effects of the individual factors are differentiated and added to model the data.
It can be represented by:
𝘆(𝘁) = 𝗟𝗲𝘃𝗲𝗹 + 𝗧𝗿𝗲𝗻𝗱 + 𝗦𝗲𝗮𝘀𝗼𝗻𝗮𝗹𝗶𝘁𝘆 + 𝗡𝗼𝗶𝘀𝗲
🔹Synthetically it is a model of data in which the effects of the individual factors are differentiated and added to model the data.
It can be represented by:
𝘆(𝘁) = 𝗟𝗲𝘃𝗲𝗹 + 𝗧𝗿𝗲𝗻𝗱 + 𝗦𝗲𝗮𝘀𝗼𝗻𝗮𝗹𝗶𝘁𝘆 + 𝗡𝗼𝗶𝘀𝗲
🔹An additive model is optional for Decomposition procedures and for the Winters' method.
🔹An additive model is optional for two-way ANOVA procedures. Choose this option to omit the interaction term from the model.
🔹An additive model is optional for two-way ANOVA procedures. Choose this option to omit the interaction term from the model.
MULTIPLICATIVE MODEL
🔹In this model, the trend and seasonal components are multiplied and then added to the error component.
🔹It is not linear, can be exponential or quadratic
𝙮(𝙩) = 𝙇𝙚𝙫𝙚𝙡 * 𝙏𝙧𝙚𝙣𝙙 * 𝙎𝙚𝙖𝙨𝙤𝙣𝙖𝙡𝙞𝙩𝙮 * 𝙉𝙤𝙞𝙨𝙚
🔹In this model, the trend and seasonal components are multiplied and then added to the error component.
🔹It is not linear, can be exponential or quadratic
𝙮(𝙩) = 𝙇𝙚𝙫𝙚𝙡 * 𝙏𝙧𝙚𝙣𝙙 * 𝙎𝙚𝙖𝙨𝙤𝙣𝙖𝙡𝙞𝙩𝙮 * 𝙉𝙤𝙞𝙨𝙚
🔹This model assumes that as the data increase, so does the seasonal pattern. Most time series plots exhibit such a pattern.
How to choose?
Choose the multiplicative model when the magnitude of the seasonal pattern in the data depends on the magnitude of the data.
In other words, the magnitude of the seasonal pattern increases as the data values increase and decrease as the data values decrease.
Choose the multiplicative model when the magnitude of the seasonal pattern in the data depends on the magnitude of the data.
In other words, the magnitude of the seasonal pattern increases as the data values increase and decrease as the data values decrease.
Choose the additive model when the magnitude of the seasonal pattern in the data does not depend on the magnitude of the data.
In other words, the magnitude of the seasonal pattern does not change as the series goes up or down.
In other words, the magnitude of the seasonal pattern does not change as the series goes up or down.
Choosing a model is one of the very first steps, so we have to make sure we do it right!
Hope this helps!👍
Hope this helps!👍
• • •
Missing some Tweet in this thread? You can try to
force a refresh