
Starting a thread to collect some insights on $RDFN.
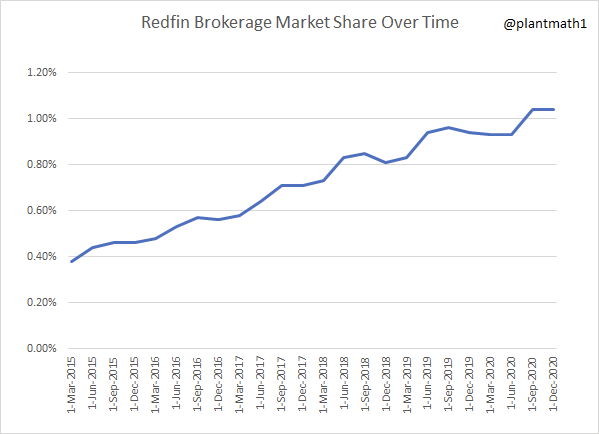
First: Redfin's Brokerage Market Share since 2015. Chugging along up and to the right, broke 1% recently.
First: Redfin's Brokerage Market Share since 2015. Chugging along up and to the right, broke 1% recently.
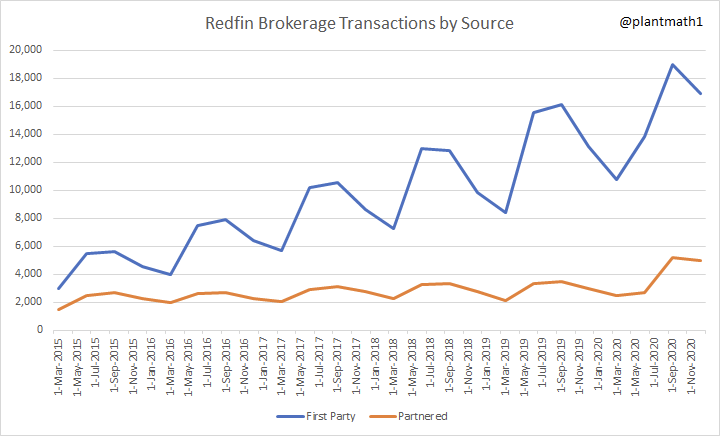
Second: $RDFN's brokerage transaction over time, by source.
Three thoughts.
1) Immense seasonality.
2) Use of partnered agents hasn't really moved except during the last two quarters.
3) First party transactions are up and to the right.
Three thoughts.
1) Immense seasonality.
2) Use of partnered agents hasn't really moved except during the last two quarters.
3) First party transactions are up and to the right.
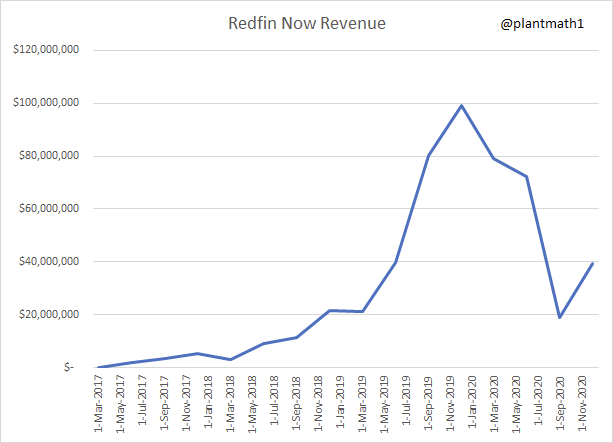
Third: $RDFN Redfin Now (iBuying) was shut down during COVID which is the primary reason why this company (and $Z) can't be analyzed on the topline.
As they restart iBuying, topline growth is going to look insane in 2021.
As they restart iBuying, topline growth is going to look insane in 2021.
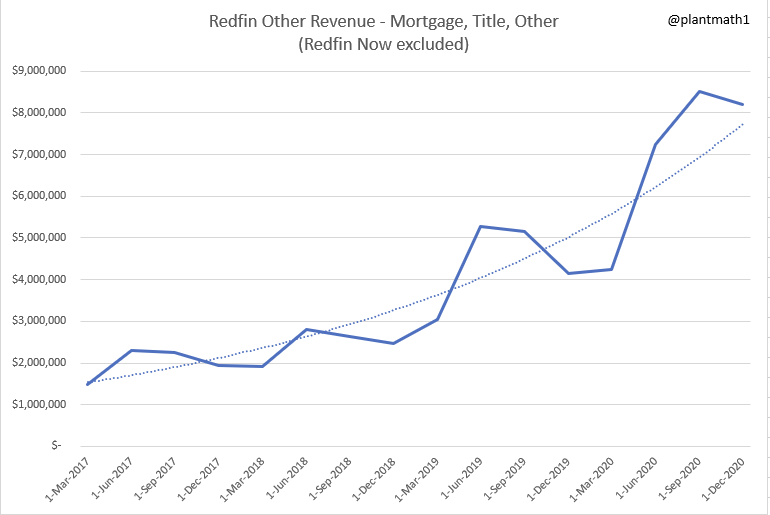
4/ $RDFN Other revenue, which includes Redfin Mortgage, Title Forward, and data/advertising revenue, has begun to take on the beginnings of an S-curve shape.
Dotted line is the exp trendline.
Dotted line is the exp trendline.
5/ Question: "Is there evidence that $RDFN is increasing the attach rate of mortgage and title services?"
I created a metric of the percentage share among other and Redfin brokerage revenue.
This shows that an increasing % of customer spend with $RDFN is on mortgage & title.
I created a metric of the percentage share among other and Redfin brokerage revenue.
This shows that an increasing % of customer spend with $RDFN is on mortgage & title.

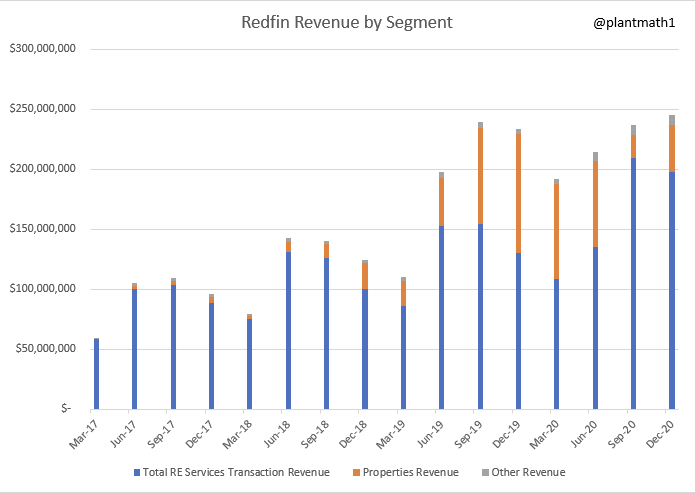
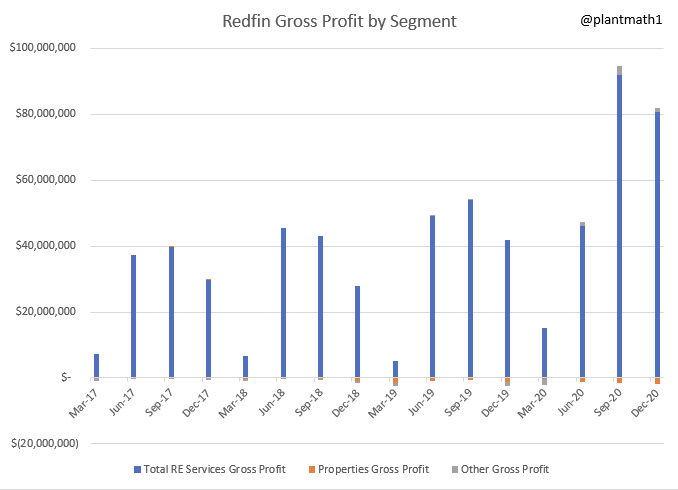
6/ $RDFN Revenue and Gross Profit by Segment
You see iBuying, while impactful on the top-line, has effectively no impact on the profitability of the business.
Even the most efficient iBuyer, $OPEN, only saw 8.5% GPM in 2020 - why I constantly caution on using EV/S for iBuyers.
You see iBuying, while impactful on the top-line, has effectively no impact on the profitability of the business.
Even the most efficient iBuyer, $OPEN, only saw 8.5% GPM in 2020 - why I constantly caution on using EV/S for iBuyers.
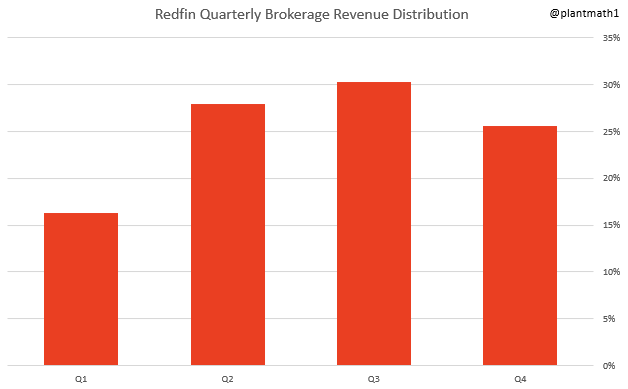
7/ $RDFN Quarterly Brokerage Revenue Distribution
I take the average quarterly share of a year's brokerage revenue since 2015.
Q1, on average, only composes 16% of a year's revenue. The summer selling season is much more important.
Revenue in Q3 is, on average, double Q1.
I take the average quarterly share of a year's brokerage revenue since 2015.
Q1, on average, only composes 16% of a year's revenue. The summer selling season is much more important.
Revenue in Q3 is, on average, double Q1.
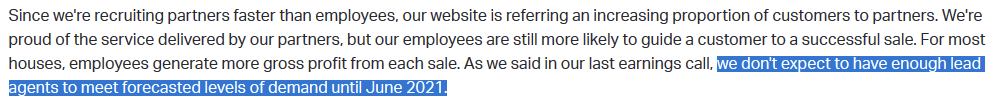
8/ There is a non-zero chance that $RDFN doesn't experience the above drop-off in 1Q2021 which would have huge implications for 2021 total revenue.
Management cannot hire agents fast enough to meet demand - and that was with 51% growth in 4Q2020.
Management cannot hire agents fast enough to meet demand - and that was with 51% growth in 4Q2020.
9.1/ Average Transactions Per Agent
This may be the best bear argument for Redfin. There is no attempt to juice agent productivity as they want the best customer experience.
In Q1, an agent does ~6 transactions. It maxes out in Q2 and Q3 where an agent does ~10.
This may be the best bear argument for Redfin. There is no attempt to juice agent productivity as they want the best customer experience.
In Q1, an agent does ~6 transactions. It maxes out in Q2 and Q3 where an agent does ~10.
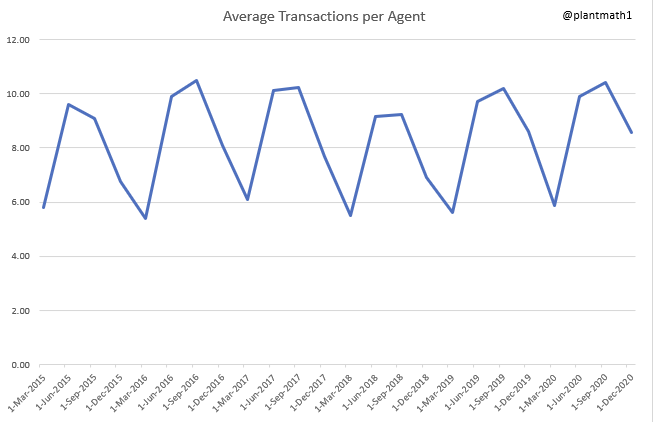
9.2/ Average Transactions Per Agent
The bear argument would be that their profitable revenue is primarily a function of their agent headcount, which is not easily scalable as management has said they are struggling to hire enough agents. This argument ignores partner revenue.
The bear argument would be that their profitable revenue is primarily a function of their agent headcount, which is not easily scalable as management has said they are struggling to hire enough agents. This argument ignores partner revenue.
10/
Great conversation with a former Redfin agent.
"This is a tech company in a real estate agent's clothing. They started as tech and they will forever be tech. They are successful through tech."
Great conversation with a former Redfin agent.
"This is a tech company in a real estate agent's clothing. They started as tech and they will forever be tech. They are successful through tech."
• • •
Missing some Tweet in this thread? You can try to
force a refresh


