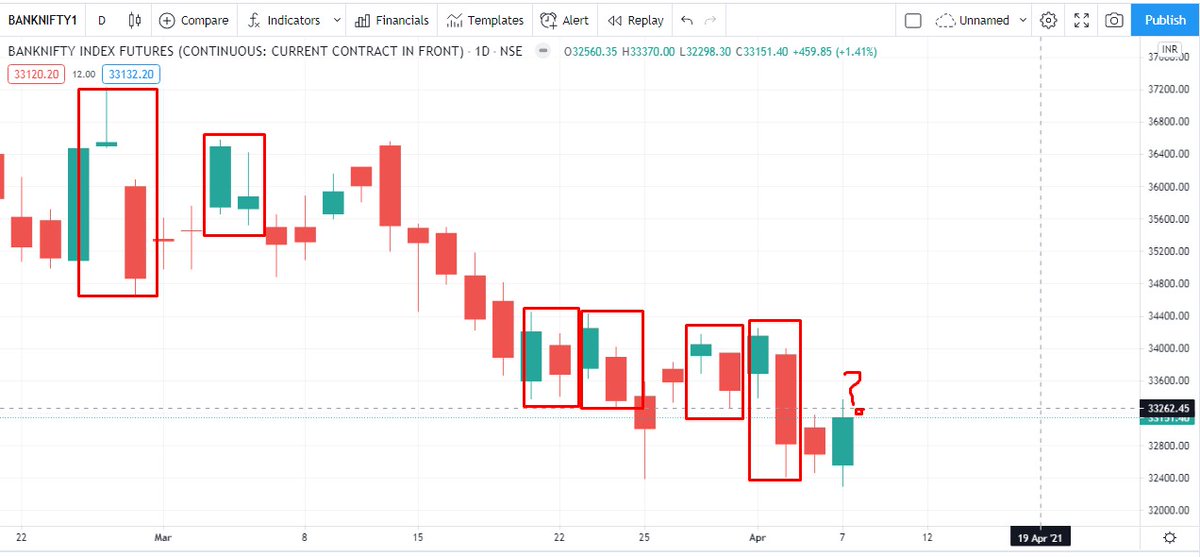
To mentally take a break , as it was getting exhausting psychologically, went back to charts. Analysing BNF to explain what I saw on Friday which prompted me to carry shorts
COI started increasing over past two day, short buildup as price down+COI up. This is OIV Analyzer end of day
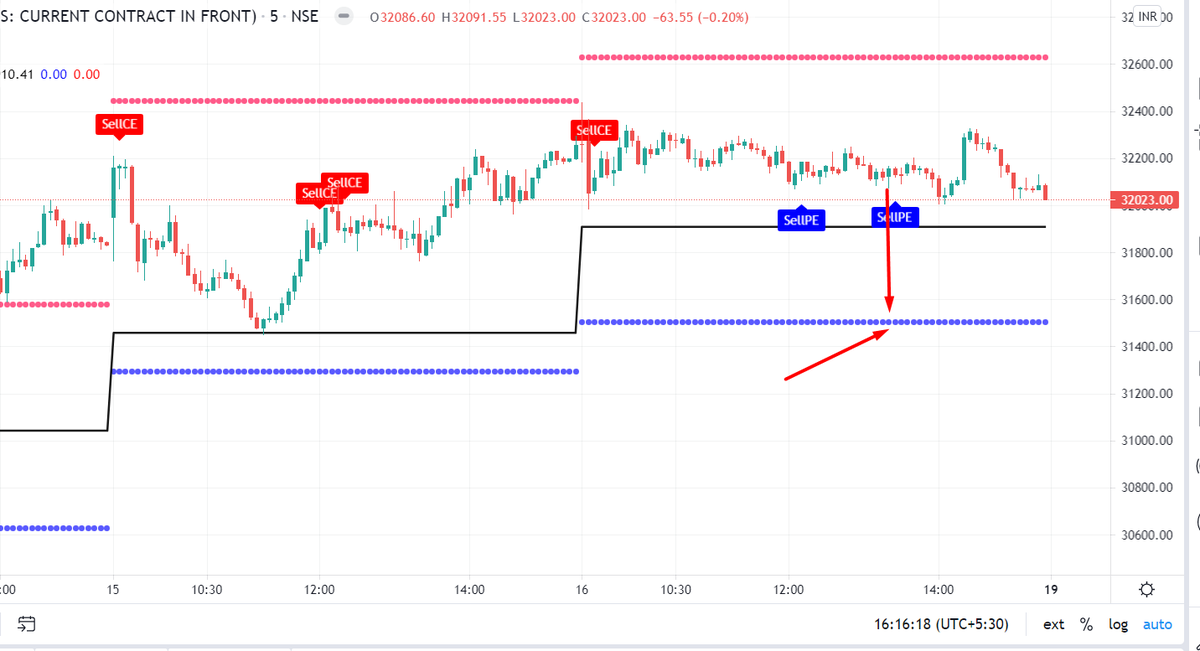
Now see the realtime charts. understand the context. The rise in COI over the day got trapped in the last 30 min selloff. The whole COI builtup has an average price of around 32k. Downsides may be in this manner :
below 32000--->31800
below 31800--->31400
below 31400--->30500
Like everything, this is a probability..not a sureshot. Hence I went in with a put backspread
Sell 1*32kpe +2*31500pe
A backspread is in essence a volspread, I am long vols. So a fall should spike up vols which should help me as a buyer. Read :
zerodha.com/varsity/chapte…
I knew HDFCBANK was coming out with results on Saturday. If results were more than expectations, then BNF would go up. A put backspread is a defined risk strategy which will have limited loss if BNF goes up ( my debit is around rs,75, I will be able to bet out at 30-40 loss)
The risk increases as we go to the end of expiry with max loss if BNF expires at my bought strike, i.e 31500. This zone is called the valley of death.
But I am not going to hold this after tomorrow whatever happens, so I am safe from the valley of death
This is a powerful safe strategy if you are expecting a large move on one side. If you are horribly wrong and the market does opposite, you can be out with a defined loss. Play this strategy in the early part of an expiry, not near the end
Made a mistake on the eod OI screenshot, apologies ( old screenshot posted in mistake.
This is the correct pic

• • •

Missing some Tweet in this thread? You can try to force a refresh
 

Keep Current with Subhadip Nandy

Subhadip Nandy Profile picture

Stay in touch and get notified when new unrolls are available from this author!

Read all threads

This Thread may be Removed Anytime!

PDF

Twitter may remove this content at anytime! Save it as PDF for later use!

Try unrolling a thread yourself!

how to unroll video
  1. Follow @ThreadReaderApp to mention us!

  2. From a Twitter thread mention us with a keyword "unroll"
@threadreaderapp unroll

Practice here first or read more on our help page!

More from @SubhadipNandy16

16 Apr
Awesome, you guys have now started doing the exact trades I do 😀 Image
Was already in some 31500PE sells based on this, those too depreciated sharply when BNF went up. A neat 55 points there too ImageImage
Had a loss trade earlier Image
Read 4 tweets
15 Apr
Ok, here goes the story.Morning received this message Image
Like an idiot, I fell into the trap. Clicking the link took me to an official looking webpage of twitter. Asked for mobile authentication ( i had 2FA on) Image
This is handle which did this, looked like exact Twitter Support handle. ( now changed after I reported this to twitter ). Had a blue tick , verified mark ImageImage
Read 7 tweets
12 Apr
There was a slight short buildup on friday, but what's alarming in the COI build-up today till now .
Get ready for a wild ride.... ImageImage
There are some markets you trade aggressively and some markets you watch. This is a market to watch for next 2 hours for me. Will be interested to see if this COI is carried into closing
And those who are asking me up or down, I honestly don't know. I was playing this for a 31k target, once that has been met will have to reassess post closing. Intraday might take small trades only
Read 4 tweets
8 Apr
The BNF OI puzzle, what I think happened. This is post mortem analysis 😀

COi was going up like crazy since early March, positions were being created in far month ( go thru my previous tweets) Image
OI = net shorts = net longs. So informed traders were taking a huge position expecting a parabolic move ( we did not know whether up or down). As of now, my guess is that the whole position was a long position. Someone had the info of the rate cut
You can see that the positions were cut hugely on 1st April. What happened on 1st April ?

This happened 👇👇 Image
Read 9 tweets
7 Apr
In technical analysis, majority of the patterns were first observed visually and then the rules made. Observing this interesting phenomenon on BNF over the past one month.
Any strong up day on BNF is immediately followed by a gap down open from the previous closing Image
So any upmove /upday is almost never having any follow-up buying the next day. Unless this pattern gets broken by 1-3 days of upmove after a strong closing, BNF looks extremely bearish. The logic of BNF seems to be " will kick your ass if you take bullish positions overnight" 😀
Jokes apart, if you want to understand the logical basis of patterns, this book is still the best :
Technical analysis of stock trends by Edwards and Magee

quantgym.biz/post/the-only-…
Read 5 tweets
25 Mar
Received quite a few questions on VIX, that why isn't VIX spiking up in this volatility and in this downmove ( VIX generally spikes up when index goes down, that's why it's also called the ' Fear Index'
The question is valid. This is what I think is happening :
VIX is calculated on the order book of options, this months and next months so close to expiry. VIX is kinda weighted average of the individual options volatilities
Volatility or IV is basically demand and supply. More demand for options, higher IV and more supply of options, lower IVs
Read 6 tweets

Did Thread Reader help you today?

Support us! We are indie developers!


This site is made by just two indie developers on a laptop doing marketing, support and development! Read more about the story.

Become a Premium Member ($3/month or $30/year) and get exclusive features!

Become Premium

Too expensive? Make a small donation by buying us coffee ($5) or help with server cost ($10)

Donate via Paypal Become our Patreon

Thank you for your support!

Follow Us on Twitter!