LONG THREAD: my last thread started out as a discussion about gaining an edge in fundamental investing by better understanding a given company's business strategy...and ended up dissecting #ARK specifically. Let's face it, ARK is fascinating. So sit back & let's dig in some more.
https://twitter.com/ttp_cap/status/1380634961594699776
2/This is super duper long but I promise there's some good data if you stick around to the end. In the prior thread I left out what was maybe the most startling quote from @tracyalloway & @TheStalwart 's Odd Lots Feb podcast w/ARK's Head of Research Brett Winton. Here it is: 
3/Wow. That quote reminds me of another skill that all great fundamental investors have: the ability to parse thru reams of corporate speak, PR, and marketing BS to be able to find the few truly important statements by the management team that matter in understanding a business.
4/Chew on that Winton quote for a minute...if you're first reaction to that wasn't "whoa" or "holy $***" or some similar colloquialism, I'd read it again! Then ask two questions: 1) why would he say this? 2) how wld you react if an exec at any company you invested in said this?
5/The answer to the 2nd question isn't too hard. But the 1st question is more complicated. It ties back to my last thread/the rest of Winton's commentary about being "uniquely wrong" and Wood's strategy of socializing research before it's fully baked ("not when it's finished").
6/So let's examine the first question: why would Winton say it's ”likely” that people will think ARK was a “scam” at some point? There are multiple vectors you cld take to answer this. This thread will look at one angle in particular - Performance and how it is tied to Flows...
7/I'll start w/a simple financial markets truism: great performance = you're right/smart/awesome/successful; bad performance = you're wrong/dumb/terrible/a failure. I'm not saying this is correct; I'm just saying this is universally the perception in the investing world.
8/If your performance is bad, no one cares about your process, your models, that you were early, or how "right" your forecasts were. Likewise when performance is great, very few people care how you got there, just that you made money...unless or until performance slips...
9/And this is where the rubber hits the road for ARK - they're sitting on ~$50 BILLION of AUM across the family of 6 Active ETFs, and I'm gonna go out on a limb here and say ~0% of those assets is probably worried about how "uniquely wrong" some of ARK's past forecasts have been.
10/Why is that? One simple answer: Performance. ARK ETFs tonned it in 2020. Everyone knows the numbers, but here's a basic chart just to put them in perspective - I included the 3 largest ARK active ETFs vs QQQ, SPY, and Morgan Stanley Growth fund (managed by Dennis Lynch):
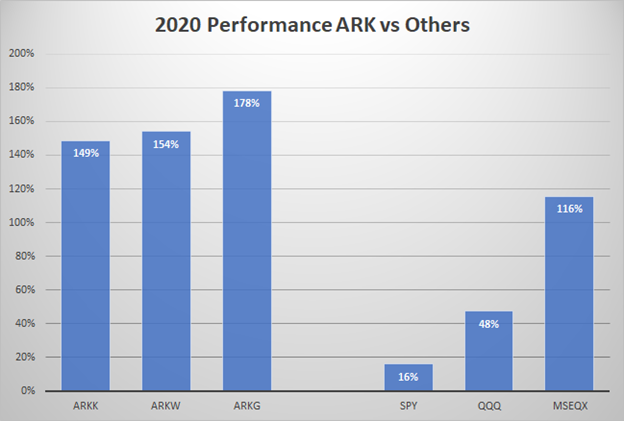
11/The analyst in me sees that chart and wants to do 2 things: (a) look at a track record beyond just 1 year, and (b) deconstruct the '20 performance to understand what drove it and if it's sustainable/repeatable or an anomaly. This is where things start to get more intriguing...
12/Re: the first point, $ARKK has 5 full years of performance data prior to 2020 to look at. I wld characterize those yrs as follows:
2015: poor
2016: bad
2017: awesome
2018: decent
2019: meh
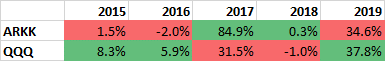
Again, just my opinion. Here's a table for perspective:
2015: poor
2016: bad
2017: awesome
2018: decent
2019: meh
Again, just my opinion. Here's a table for perspective:
13/My dimwitted view of every single year isn't that important, but at first glance I saw it like this:
15: underperformed [-]
16: lost money in an up market [--]
17: crushed it [++]
18: broke even in a down market [+]
19: up 35%...but SPY was +29% and Qs were +38% so...[?]
15: underperformed [-]
16: lost money in an up market [--]
17: crushed it [++]
18: broke even in a down market [+]
19: up 35%...but SPY was +29% and Qs were +38% so...[?]
14/Imo a mixed overall track record, w/17 as an outlier. But before I dug into '20 I thought let's go back and figure out why '17 was so strong and if there's any correlation to the '20 performance...if you've stuck w/me this long, good, bc now it goes from intriguing to crazy.
15/The 1st thing u notice about '17 is that Bitcoin Investment Trust (GBTC) shows up as a top position for $ARKK and $ARKW. Ok now the stellar '17 makes more sense ($BTC was up ~1700%). Before I do a full deconstruction of the '17 performance I see something that blows my mind...
16/The fund size. Aka AUM or Total Net Assets of the ARK ETFs back in 2017. I will give you 25 guesses at how big $ARKK was on Jan 1 '17, and the first 24 don't count. Ok I lied I'll give you no guesses I'll just tell you - it was $12 MILLION. As in 8 figures...
17/I use FactSet so obv I thought there was a data error in my model. Turns out there was no error. Perspective: $ARKK in '17 was ~1/3 the size of @TheRoaringKitty 's current GME position! Random crypto bros are whipping around more capital than $ARKK had in AUM back then.
18/In fact the total of all ARK active ETFs (ARKK/G/Q/W) only 4 years ago was ~$54mil in total assets, up from only ~$44m in '16. Over 2 full years post-launch, ARK, for all intents and purposes, was the size of a middling high net worth client at a PWM broker. This blew my mind.
19/So 2017 isn't even worth dissecting. Neither for that matter is 2015 or 16. I have no idea how ARKK underperformed so badly in '15 or lost money in an up market in '16 on such a tiny asset base, but simply put, if you're analyzing ARK ETFs today, that data doesn't matter.
20/You have to throw out 2015-17 performance b/c it's irrelevant to analyzing a fund manager who controls ~$50bn of AUM today. If you don't believe me, just ask anyone who's ever gone from managing $50 million to even $500m or $1 billion! It's a totally different ballgame.
21/That leaves us w/2018-20 to analyze. With the big '17 performance #s (on the absurdly low asset base), combined w/a relentless onslaught of whitepapers, webinars, interviews, and the full court press of their social media PR strategy, ARK assets finally started growing in '18.
22/Per the annual report, ARK had some very nice inflows for all of their ETFs throughout the course of 2017, as you can see from the table I pulled from their filing here which runs thru Jan 31 of 2018:
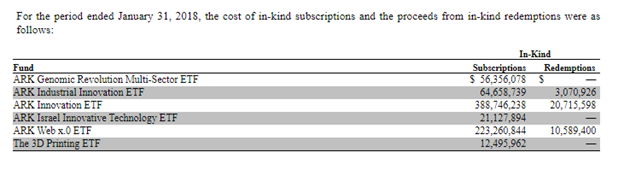
22/Heading into CY18, $ARKK was now over $375m of AUM. The top position in the fund - GBTC - was $23m, ie almost 2x the value of the entire ETF only a yr earlier! The avg position size in $ARKK at the start of '18 was $7.2m. By the end of '18, $ARKK crossed the $1bil threshold.
23/By '19 ARK no longer looked like a PWM client, but a real asset manager. One might speculate that's why the '19 returns looked similar to what you'd get from a middle of the road active "growth" fund manager - better than SPX but still trailing QQQ in a huge +year for stocks.
24/Interestingly, after seeing ~$1.4billion of inflows in '18, flows slowed to ~$500m for ARK in '19 across their family of (now 5) active ETFs. And that's when sh*t just totally went bonkers. For whatever reason (possibly the $TSLA price target hitting?), flows EXPLODED in 2020.
25/It’s nearly impossible to put into words what happened w/ARK inflows in '20, so I’ll try to use numbers/charts/graphs as much as possible. The first chart is one that I built to show the insane parabolic increase in net assets going back to 18. I left out ‘15-17 for clarity:
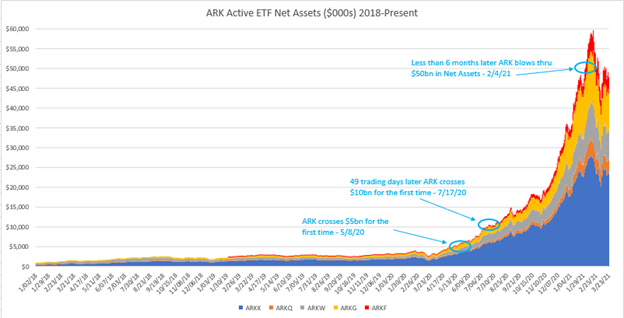
26/For 4yrs ARK managed a relatively small pool of assets, and even in 19 while accumulating multiple billions of AUM, they were still sub-$5bn. In fact, AUM for the active ETFs didn’t cross the $5bn threshold until May of last year (less than one year ago!). Then it went bananas
27/ARK hit $10bn of net assets in July of last year, and then broke straight vertical into the start of 2021 when AUM busted right thru $50 billion. Talk about the exponential age! The asset growth was simply astronomical.
28/And while ARK’s performance off the March’20 stock market bottom was a rocket ship, the INFLOWS were where the real action was. This next chart tries to show cumulative inflows to-date on an annual basis by ETF, starting in 2020. Here’s what it looks like:
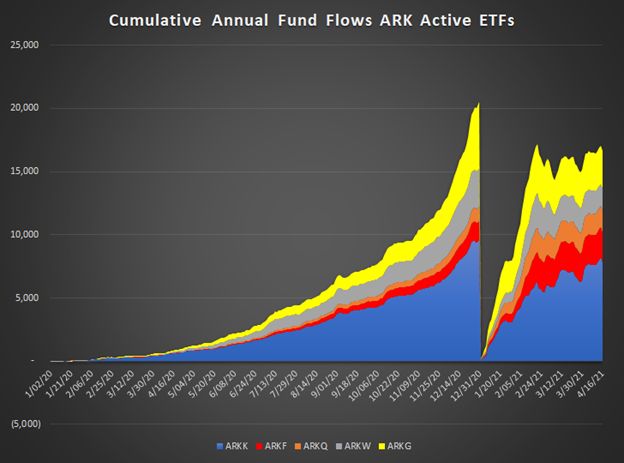
29/What’s insane about that chart is not just how huge 2020 was, but how 2021 started off on an even steeper trajectory! After taking in OVER $20 BILLION in new money in ’20, ARK started off ’21 w/another $17bn+ in under the first two months alone! These flows are staggering.
30/To put it into perspective, per Morningstar, US Equity ETFs saw $129bn of inflows in '20 in total. The vast majority of that obv goes into passive funds, yet 1 active manager (ARK) took down over 15% of all US Equity ETF flows? I’d defer to pros, but I blv that’s unprecedented
31/Per etf.com, ARK has become the 10th largest ETF issuer! This isn’t a PASSIVE manager. This is an active manager that literally wasn’t relevant 2+ years ago. Think about this way: TLT only has $14bn of AUM. ARK added more in INFLOWS in 1Q21 than the entire TLT!
32/Now you might say hey that’s not fair ARK is multiple ETFs and you’re lumping them into one entity…& I wld say yes, yes I am. And here’s why: if u look at the recent history, ARK is basically 1 giant fund. Doesn’t matter which one you buy – ARKG/F/W/Q, you basically own $ARKK
33/Skeptical? Here’s a correlation table for all 5 of the active ARK ETFs from the start of 2020 until now, as well as a table looking at that correlation from Dec-20 to present. Correlation is extremely high b/w ARKK and the other ETFs. Here are the tables:
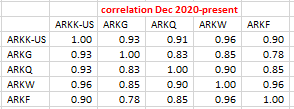
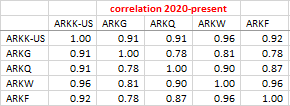
34/As you can see from those tables, as inflows exploded from late ’20 into this year, correlation between all of the ETFs has gone up. eg look at how crazy correlated Next Generation Internet (ARKW) is w/”Fintech Innovation (ARKF)!
35/There are many reasons for this obv, including flows & the preponderance of overlapping positions across the ETFs that we all know about. On my math, 35-45% of the stocks overlap across multiple ARK ETFs. This is especially true in top of book names eg TSLA, TDOC, SQ, etc.
36/So in my opinion, the only way to analyze ARK is to lump all the ETFs together. It’s basically 1 strategy w/5 sleeves. That brings us back to what drove the ‘20 performance...start w/$TSLA, a top position in ARKK, ARKW and ARKQ that went up 743% in ‘20.
37/Based on ARK’s quarterly slide decks, here’s $ARKK’s performance contribution from $TSLA in ’20:
1Q: 297bps
2Q: 1024bps
3Q: 887bps
4Q: 605bps
So 28%+ performance from one stock. Huge. But $ARKK was +150% on the year, so what drove the rest? Answer: everything
1Q: 297bps
2Q: 1024bps
3Q: 887bps
4Q: 605bps
So 28%+ performance from one stock. Huge. But $ARKK was +150% on the year, so what drove the rest? Answer: everything
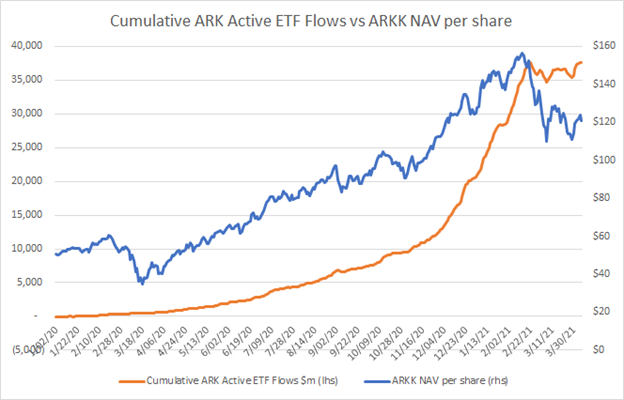
38/Yes, everything not nailed down (aka w/out Value style factor) in ’20 went up. But ARK’s book specifically outperformed everything, and it wasn’t just $TSLA being top of book. Here’s a chart that might explain it - $ARKK vs the total of all ARK inflows 2020-present:
39/I know: correlation vs causation. I’m sure people way more quantitative than me can break this down further, but the peak of $ARKK came almost in lock-step w/the peak in inflows in Feb’21. Here’s another chart showing 5-day rolling inflows mapped against $ARKK NAV:
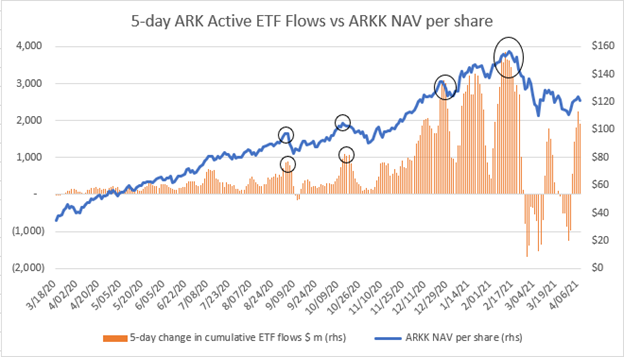
40/Chart crime? Maybe. But u can see from the circled areas (and even earlier), every short-term peak in $ARKK in '20 coincided w/a temporary short-term peak in inflows, culminating in the Feb’21 peak when 5day inflows peaked at ~$3.9bn and the ETF peaked at ~$156 (closing high).
41/Why did this happen & why did it become increasingly more pronounced into ’21? Easy – SIZE. In sports, the axiom is this: Speed Kills. In fundamental active management investing, it’s: Size Kills. This is true across multiple different vectors (not just for fundamental PMs).
42/Many have referenced the 1997-2002 era Janus Twenty fund re: ARK parallels today. I’d highly encourage you to listen to @EricBalchuns ‘s Trillions pod w/Scott Schoeizel, the Janus PM. The biggest area of caution he repeatedly mentions is Size:
podcasts.apple.com/us/podcast/tri…
podcasts.apple.com/us/podcast/tri…
43/I cld write an entire thread on Janus Twenty, but listen to that pod and consider there was a reason why Janus Twenty was CLOSED by the end of 1998. Or listen to @choffstein ‘s Flirting w/Models pod w/@JasonAThomson from 2019:
podcasts.apple.com/us/podcast/jas…
podcasts.apple.com/us/podcast/jas…
44/Thomson gives some stats: in his database of 7,000 stocks, only 500 trade $100m+ per day (ADV); 175 trade +$250m, 75 trade $500m+, and only 25 trade $1bn/day. Size matters. Simple math: to build a $100m position in $100m ADV stock, it takes 10 days at 10% of volume…
45/Ever try being 10% of volume in a stock for 10 days in a row? If you have, you know it’s extremely un-fun. Why? Because HFTs…Someone smarter than me will know what % of volume these days is HFT, but let’s just assume 50% of advertised volume isn’t “real”.
46/If you’re 10% of ADV, you’re probably closer to 20% of the “real” volume in the market (ie the other actors who are trading a position for more than a fraction of a second. If you don’t believe me, just ask anyone who’s managed a position of $100m, $500m, or $1bn+.
47/Now consider ARK. Back in early ‘17, the avg position size for $ARKK was…$300k. As in $300,000. The top pos was $1.1m, and a 1% pos was an absurd $120k. As of March ‘21, avg pos size had exploded to $402m! Here’s a table showing Top/Avg/1% pos sizes for $ARKK back to ’17:

48/Lols the exponential age! Forget about the 4 yr growth of 176,300%; $ARKK’s avg pos size went up 14x from only the start of ’19 to today. It’s top position ($TSLA) is 28x bigger!! A bottom of the book 1% position is now $221m.
49/I know there are MF PMs who manage more assets. I get it. But those are generally extremely diversified, benchmark-y funds, which did NOT see AUM grow by 20x in 2 yrs and tend not to see flows that look like the chart of Dogecoin.
50/The ex-PM graveyard is littered w/tombstones of managers who blew up just bc they cldn’t scale their strategy from $50m to $500m, or from $500m to $1bn. I cld be wrong, but I don’t think we’ve ever seen a single mgr active strat like this go from $50mil to $50BIL this fast.
51/Why? Go back to the #s: a 1% position is $220m in $ARKK. It wld take 20days at 10% of volume to build a 1% position in a stock trading $100m ADV, and there are only 500 of those to pick from per that @JasonAThomson stat. Imagine scaling into a top of book position…
52/What worked at $50m or $500m AUM no longer works at $50bn AUM. This is why alarm bells started going off recently about concentration risk at ARK. Stocks that cld be a 5%pos when u were a tiny ETF don’t work at this size, or u wind up owning 10-20% of a lot of stocks real fast
53/Said another way: the pond ARK is fishing in has shrunk inversely to the exponential growth they’ve seen in assets…but b/c the inflows happened so fast, ARK is now stuck holding the bag on a bunch of minnows that can’t possibly be liquidated at this scale.
54/Static analysis of entering/exiting a position at this scale falls down irl, not just bc of HFTs but also because of the simple fact that THE ENTIRE WORLD HAS ARK’S BOOK – as an active ETF, they must (and do) report their positions on a DAILY BASIS.
55/Whatever you think the risk in ARK is today, multiply it by X to factor in the countless algos that have inevitably been built to pick off their reported positions, let alone Nikko Asset Management and others who just straight-up ape the ARK ETFs.
56/If u don’t believe me and don’t believe t costs are crazy high for ARK at this size, just look at what happened in Feb when the flows hit a wall. The next chart shows performance across ARK ETFs + some of their most concentrated positions:
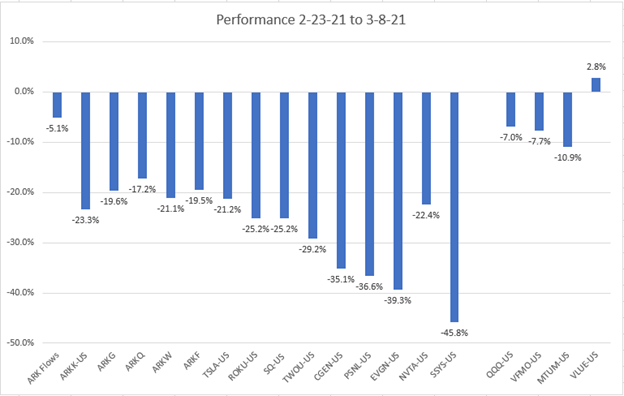
57/The active ARK ETFs dropped by ~20%...and the concentrated positions plummeted by 25-45%. I used this period bc this is when the outflows hit. All that happened was flows reversed slightly, down 5% or ~$2.9bn of redemptions. That’s it.
58/You can also see Value factor outperformed Momentum factor during this period (using VLUE and MTUM ETFs as imperfect style proxies), but it wasn’t a massive swing, & QQQ was only down 7%. To me, this looks like a very ARK-specific unwind.
59/When u dig thru the holdings, what u find is that pos sizes for the least liquid/highest concentration name dropped by 7-12% overall in terms of shares held of each, whereas shares held actually increased for some of the more liquid names like $TSLA, $SQ, and $SHOP.
60/I can only speculate why, but my guess wld be that was largely a function of already owning too big of a % of the shares outs in the smaller names. $PSNL and $CGEN are perfect examples of this. ARK owned ~19% of each as of 2/22/21…
61/By 3/8/21, ARK’s $CGEN ownership was 17.2% and $PSNL was 16.5%, still highly concentrated. My guess: they had to let the redemption process run its course bc the alternative wld have been to own 20%+ of some illiquid positions they were already too big in.
62/On 2/22, ARK owned $184m CGEN. It was a puny 0.3% position in $ terms relative to the $56bn AUM of their 5 active ETFs. PSNL was $231m, a 0.4% position. Mice nuts for ARK. Then the $ size of their respective positions dropped by 40%/44% over the course of only 10 trading days!
63/Remember, all that happened here was 5% outflows for ARK active ETFs (10day cum redemptions as % of 2/22 AUM). ARK’s shares held of CGEN/PSNL only went down by 8% and 12% respectively. The CGEN pos size went down -6bps, PSNL -10bps, that’s it! And the stocks got annihilated.
64/This is the power of the ETF model after exponential AUM growth. Active or Passive, it doesn’t matter. When redemptions hit, the process for how the stocks get sold in the mkt is exactly the same. The only way to fight it for an active manager is to increase relative pos sizes
65/…but if you’re already full up in smaller cap, illiquid names where you own 10-20% of the shares out, you’re faced w/2 crappy choices: take ownership up even more in an already bad spot, or…let the ETF redemption process run its course.
66/This is precisely why I (and lots of others) am so fascinated by ARK. It’s not about dunking on/criticizing them. Imagine Janus Twenty half as concentrated…but it wasn’t closed, it grew by infinity in 4 yrs, and they had to report positions every day…
67/…now imagine an exec at the fund coming out in like March 2000 and saying it’s “likely” that people will come to think their fund was a “scam” at some point in the future. Well we don’t have to imagine, bc it just happened w/ARK.
68/As long as this was, there are a few more threads I cld write about that single Winton "scam" quote. But this one is already wayyyyyyyyy too long. I'm a nobody, but my hypothesis is very simple: a repeat of anything close to 2020 performance (let alone '17) is not possible...
69/...at this size AUM...whereas the unwind risks (as seen in late Feb) are dramatically higher. But that's just my opinion, and as always not investment advice :) If you stuck around this long thru 69 (nice) posts, you deserve a medal. END SUPER LONG THREAD
• • •
Missing some Tweet in this thread? You can try to
force a refresh