A short city population/datanerdfest coming up in this thread, beginning with a little panoramic tour of the Tokyo metro area - city as far as the eye can see
(I made this using Google Earth Studio btw, a very useful tool)
(I made this using Google Earth Studio btw, a very useful tool)
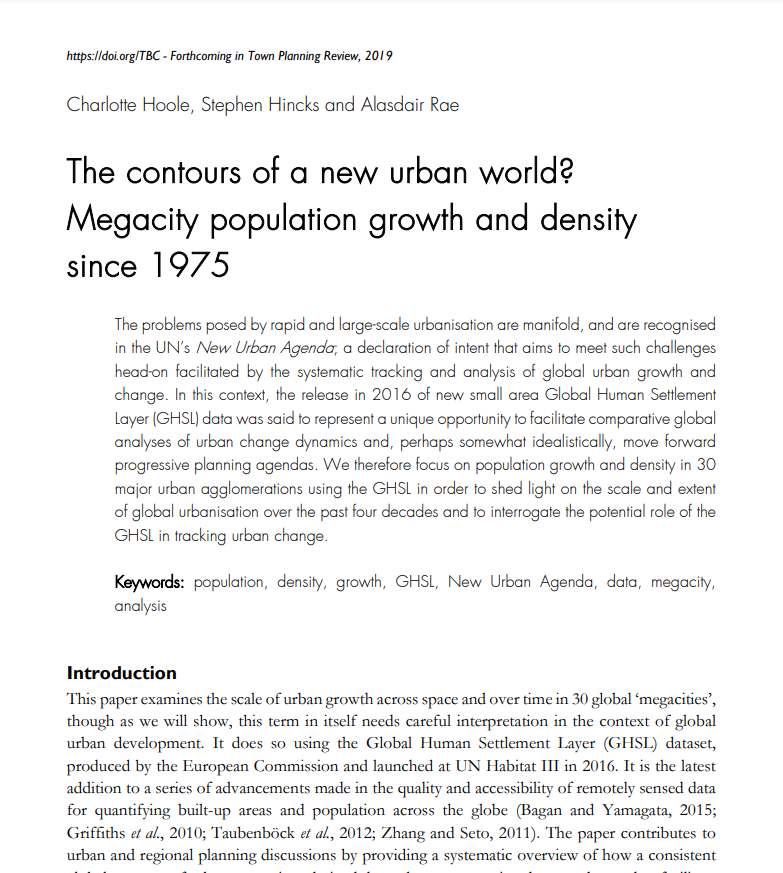
background: I have been using/playing with/analysing global city population data quite a bit over the years, most recently in an academic paper on the topic with @CJHoole and @stehincks
open access version: eprints.whiterose.ac.uk/149455/3/Conto…
open access version: eprints.whiterose.ac.uk/149455/3/Conto…
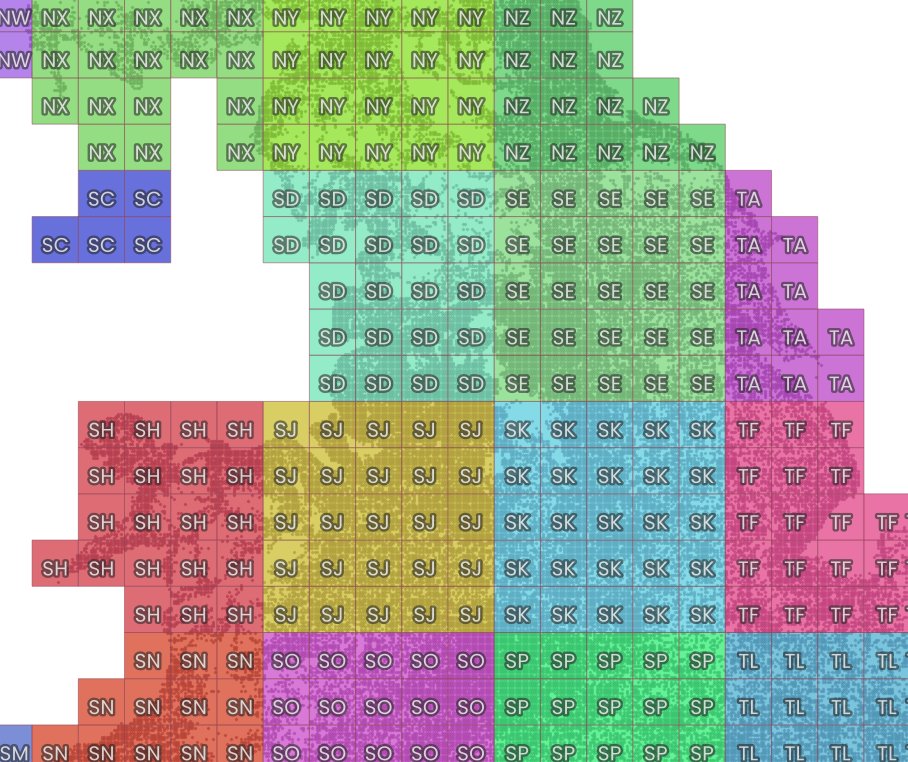
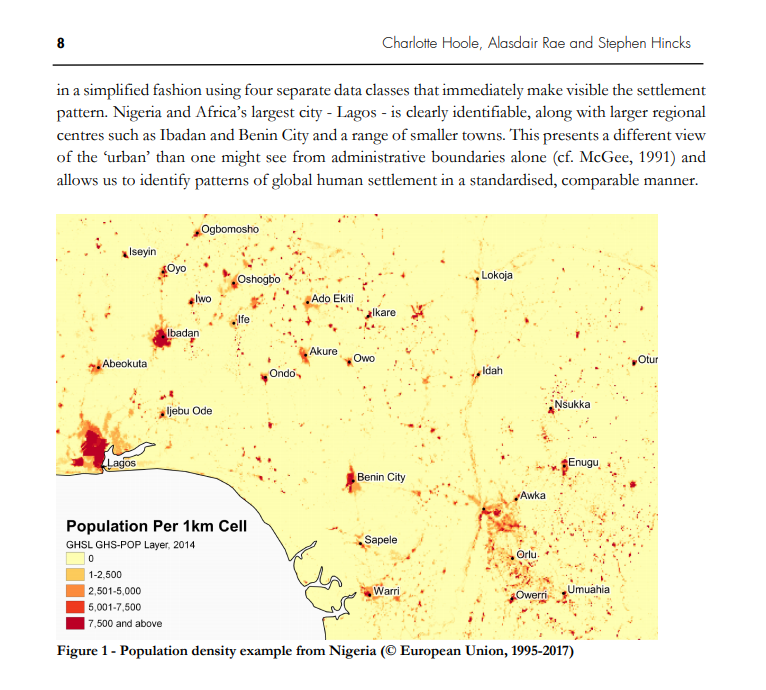
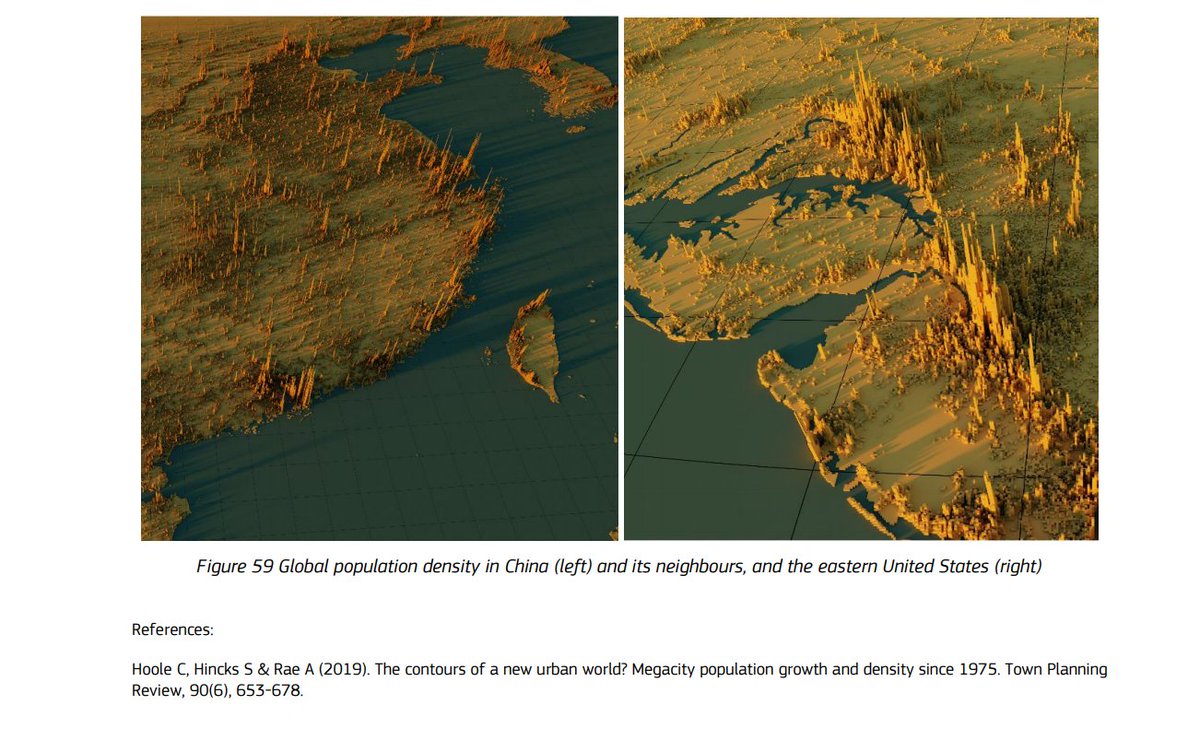
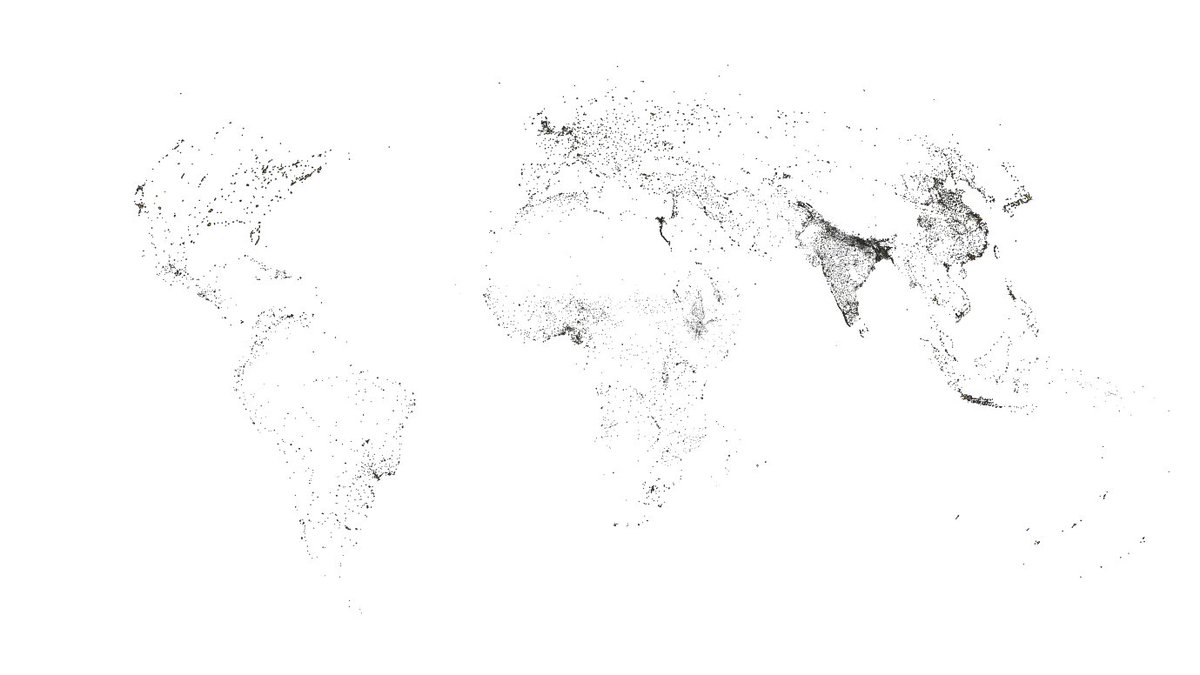
we looked at population density for the whole world, using 1km resolution data from the EU's GHSL project - e.g. here's a little snapshot of how it looks across part of West Africa, from our paper
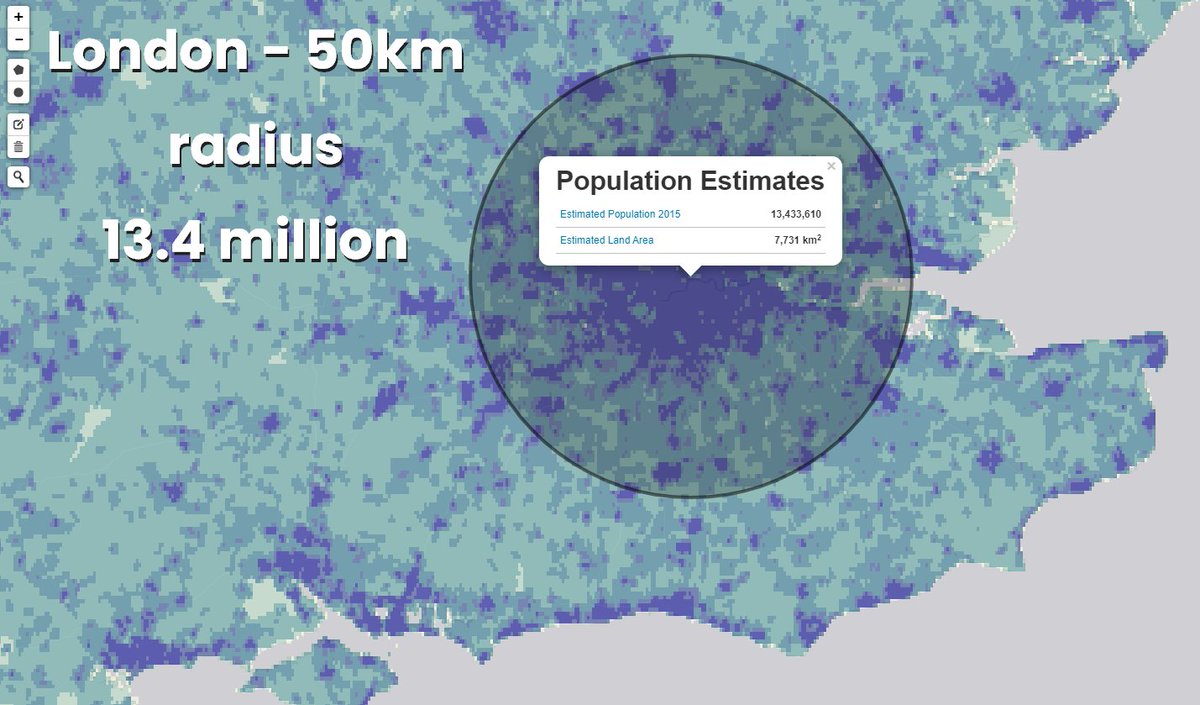
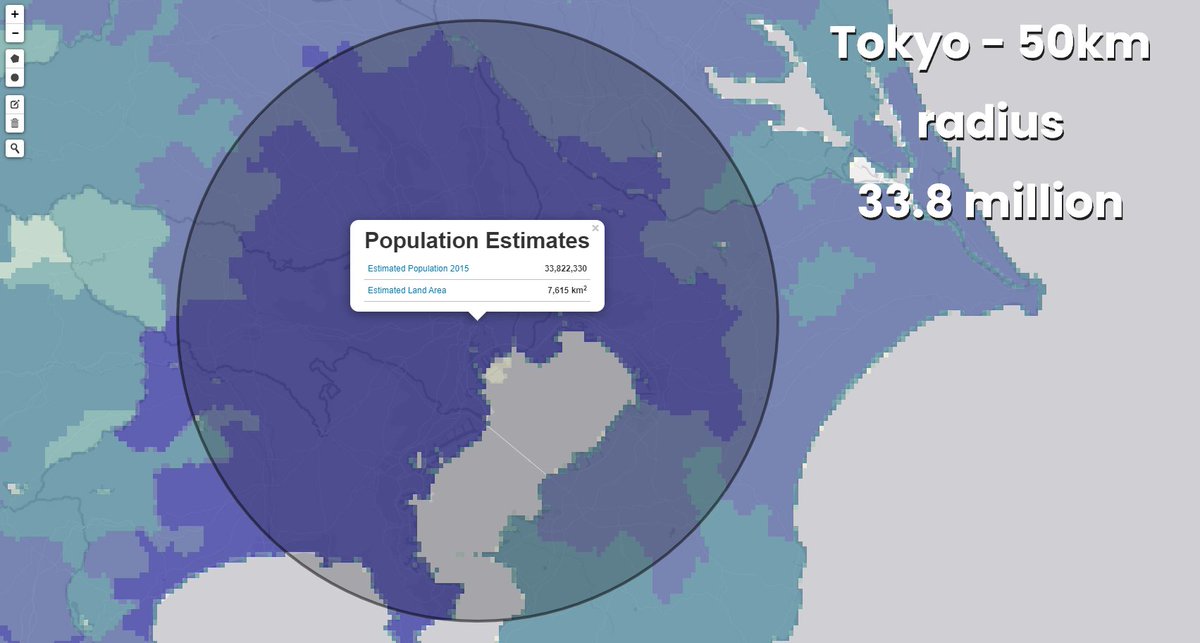
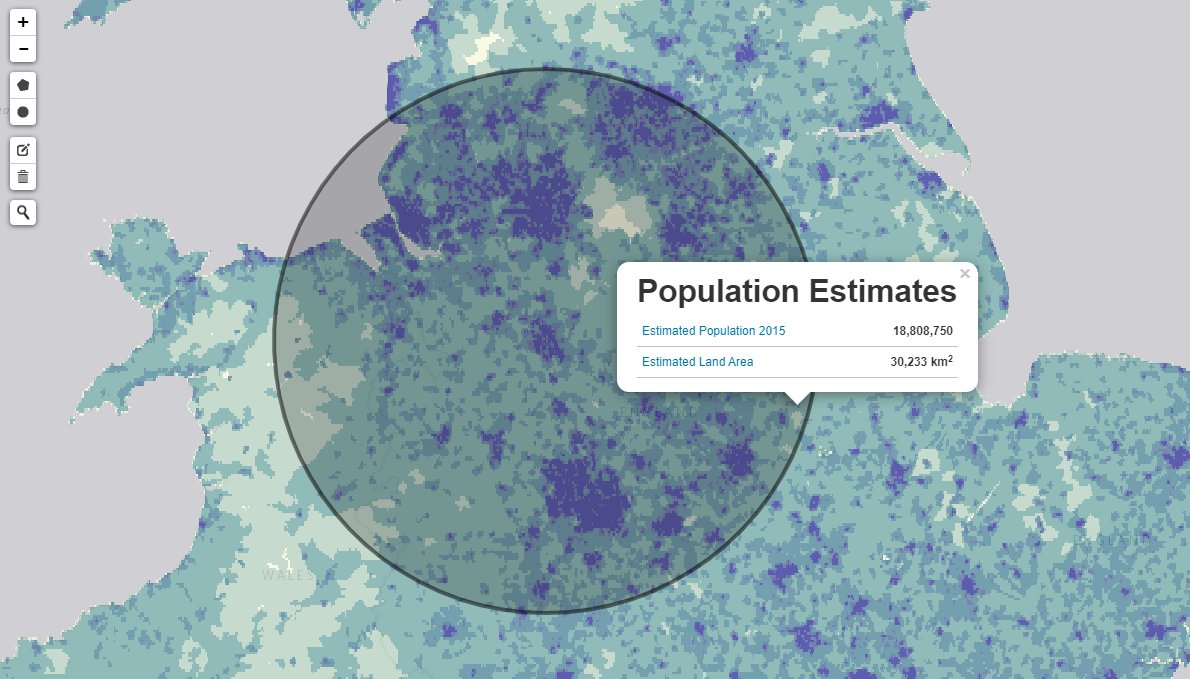
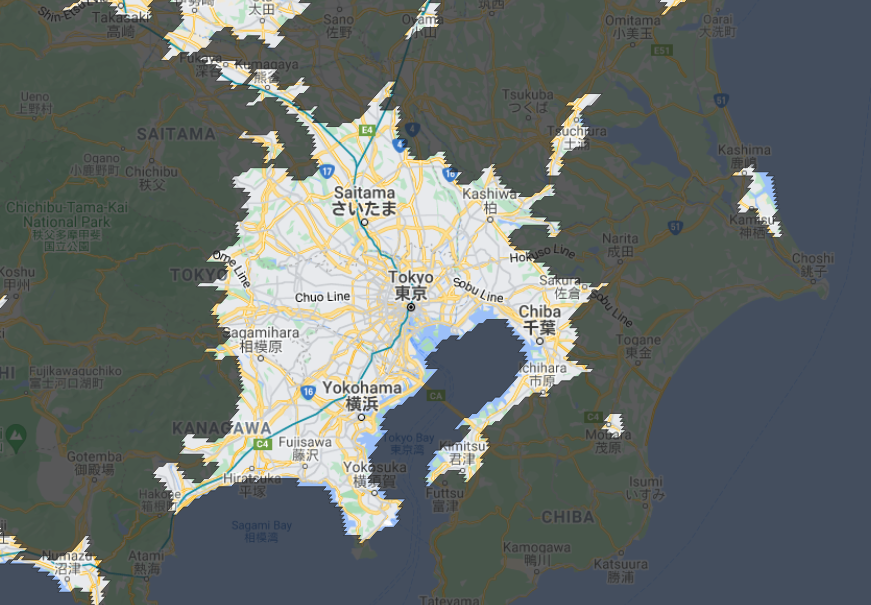
are there really a zillion people in Tokyo and not a zillion in London? That question can be answered using a simple but powerful tool like NASA's population estimator - e.g. here's what you get of you draw roughly 50km radius circles in Tokyo and London
sedac.ciesin.columbia.edu/mapping/popest…
sedac.ciesin.columbia.edu/mapping/popest…
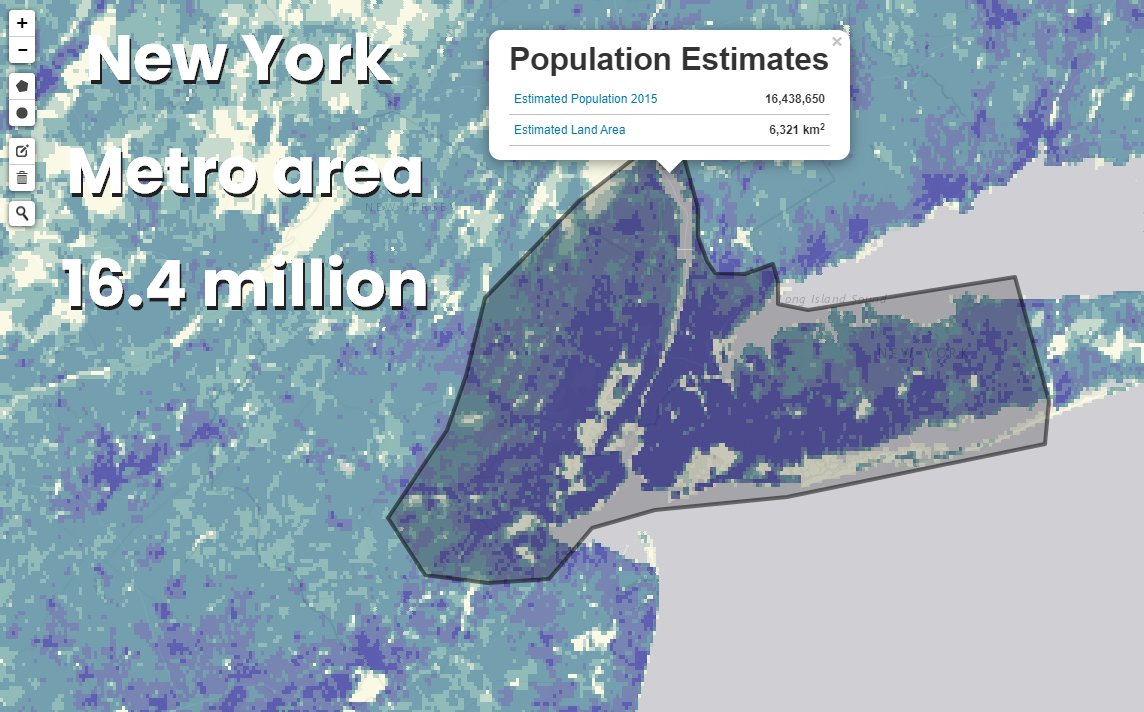
it can be quite addictive, but also useful - e.g. here's New York's wider metro area (using a boundary that doesn't officially exist, of course)
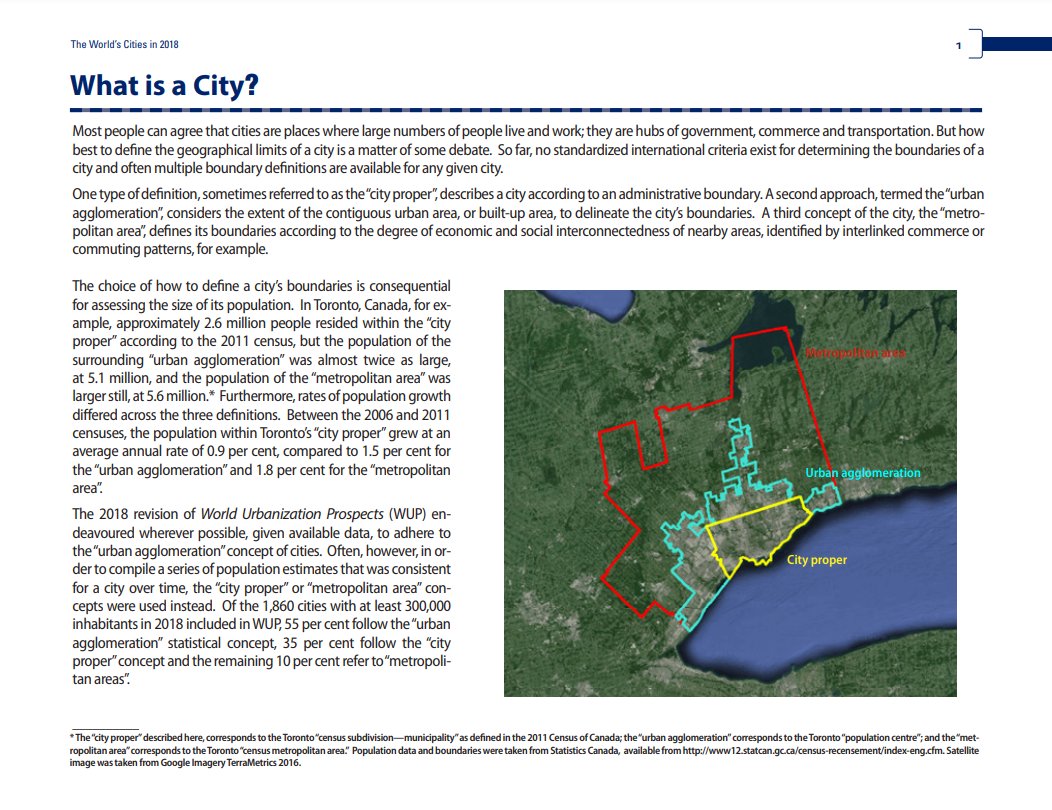
fair to say that geographers, planners and others have been looking at this kind of thing for zillions of years, of course, but it is interesting and important: e.g. take a look at the UN's 'World's Cities in 2018' report and their 'what is a city' page
un.org/en/events/citi…
un.org/en/events/citi…
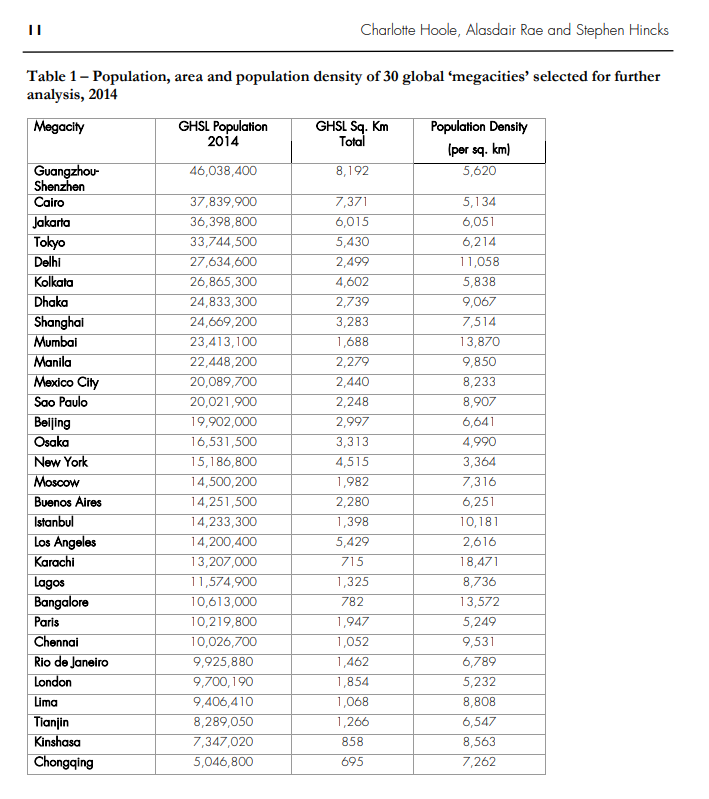
here's one table from our paper showing the 'city' populations of different urban areas based on one particular boundary definition - we also added population density figures to the table
there's a much shorter extract of our work at p. 69 in the European Commission's Atlas of the Human Planet 2020
ghsl.jrc.ec.europa.eu/documents/Atla…
ghsl.jrc.ec.europa.eu/documents/Atla…

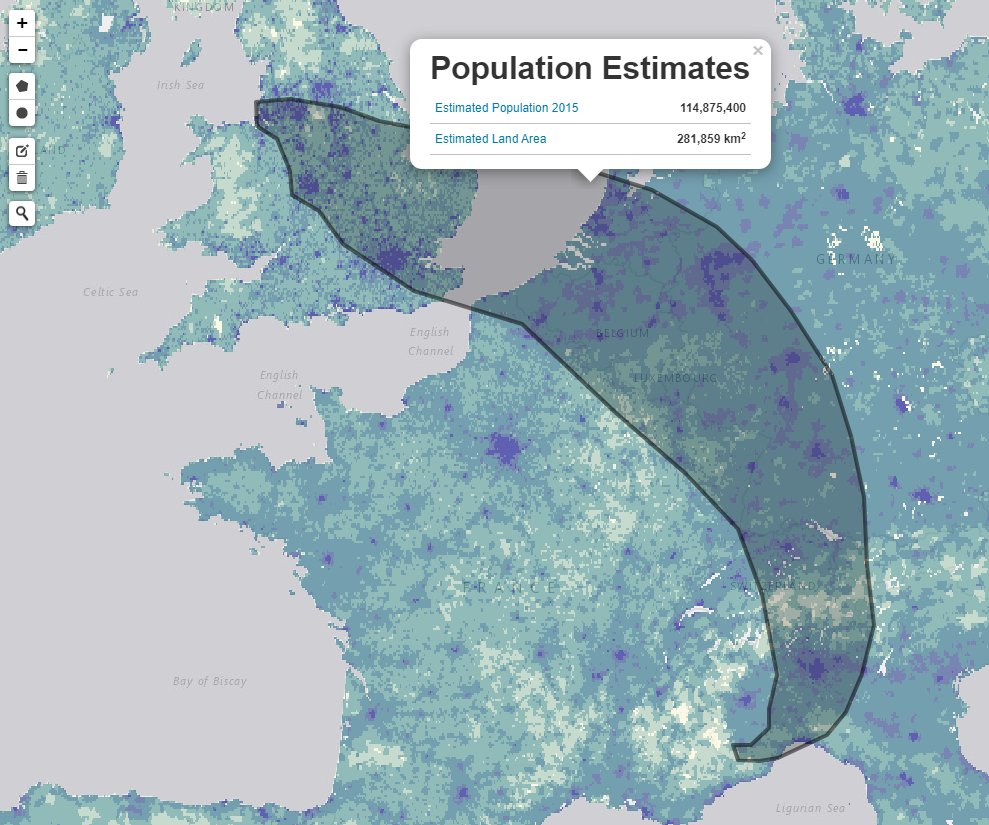
I'll end this thread with a very badly drawn 'blue banana'* which, based on my bad artwork, has a population of about 115 million
(🍌😕 *blue what? - this explains the origins of the phrase undertheraedar.com/2009/03/colour…)
(🍌😕 *blue what? - this explains the origins of the phrase undertheraedar.com/2009/03/colour…)
🚨 ADDENDUM 🚨
The Stoke-on-Trent Megaregion is 19 million people huge
(it can be quite amusing/enlightening drawing these arbitrary 100km circles on the estimator map, but watch out for varying area calcs)
The Stoke-on-Trent Megaregion is 19 million people huge
(it can be quite amusing/enlightening drawing these arbitrary 100km circles on the estimator map, but watch out for varying area calcs)
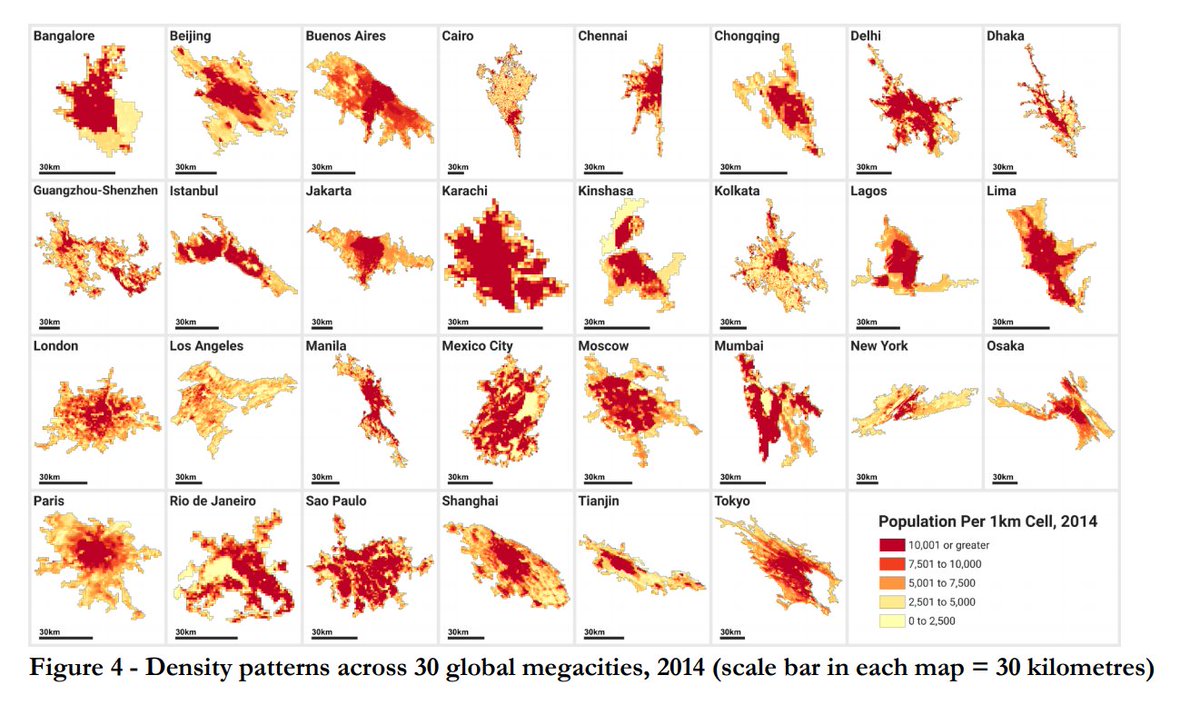
more seriously, you can actually get boundaries from the GHSL dataset as well (their GHS-SMOD 'urban centre' definition), which is what we used to compare density in the 'cities' below
ghsl.jrc.ec.europa.eu/ucdb2018visual…
ghsl.jrc.ec.europa.eu/ucdb2018visual…
- I would not be doing my job if I didn't mention the fact that the wonderful team behind the European Commission's GHSL data have released the 'urban centre' boundary file as a GeoPackage that can be used in your GIS of choice
ghsl.jrc.ec.europa.eu/download.php?d…
ghsl.jrc.ec.europa.eu/download.php?d…
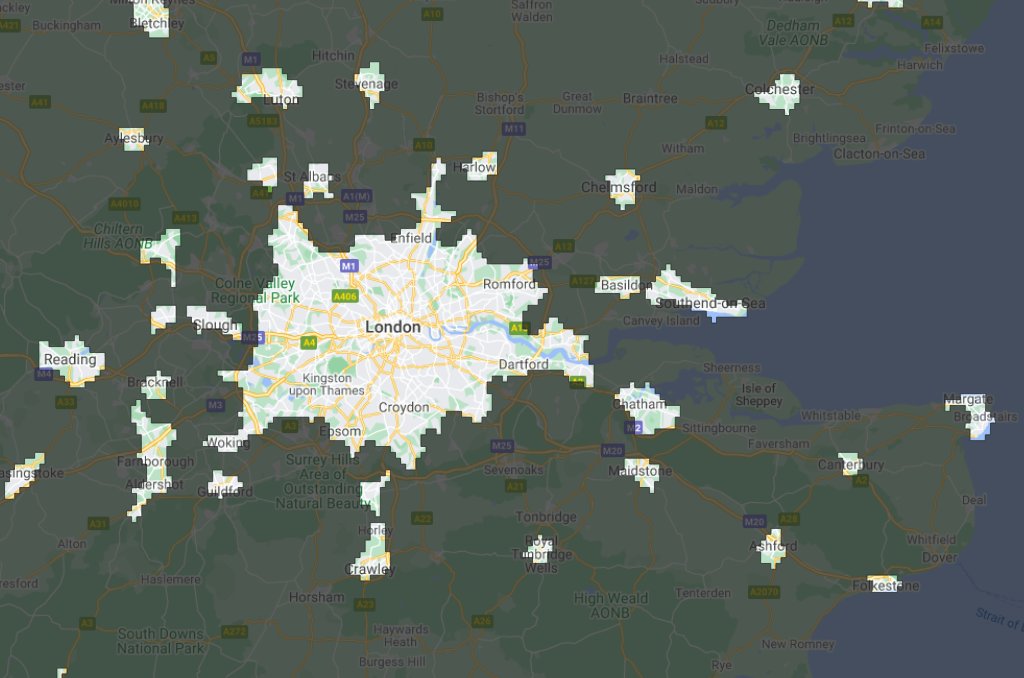
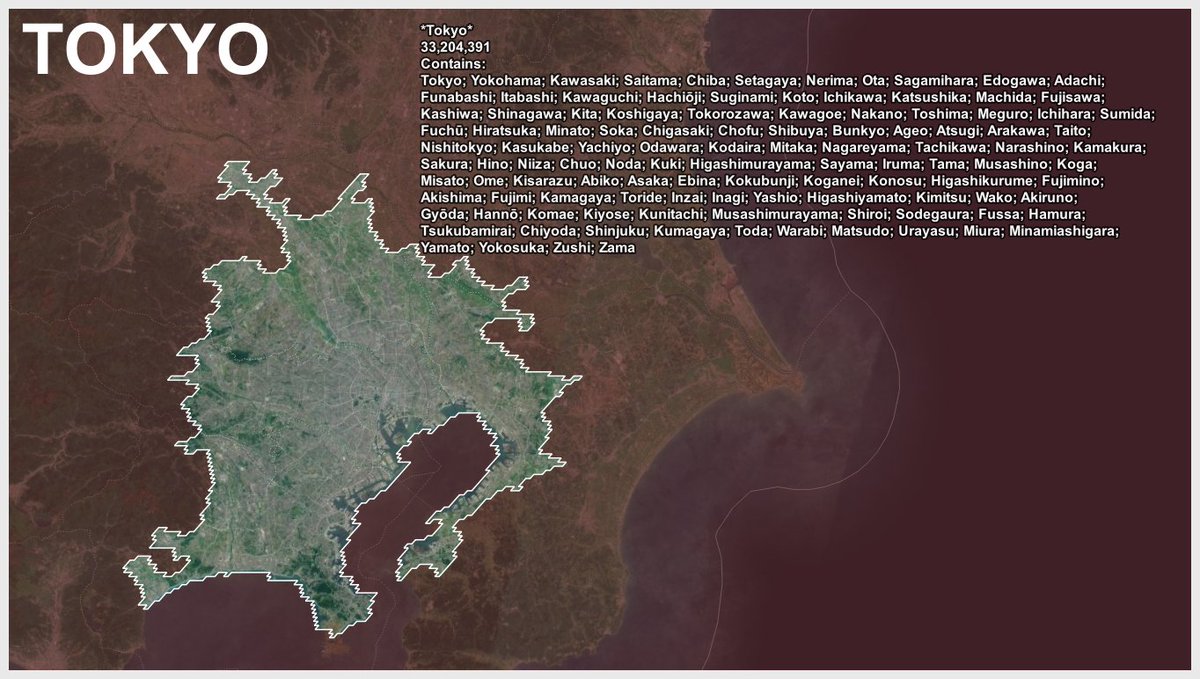
I've added this list of places in the Tokyo area - these are from the GHSL 'urban centres' boundary file - I've added all the places within the 'Tokyo' area, plus satellite background to show the extent of the urban fabric
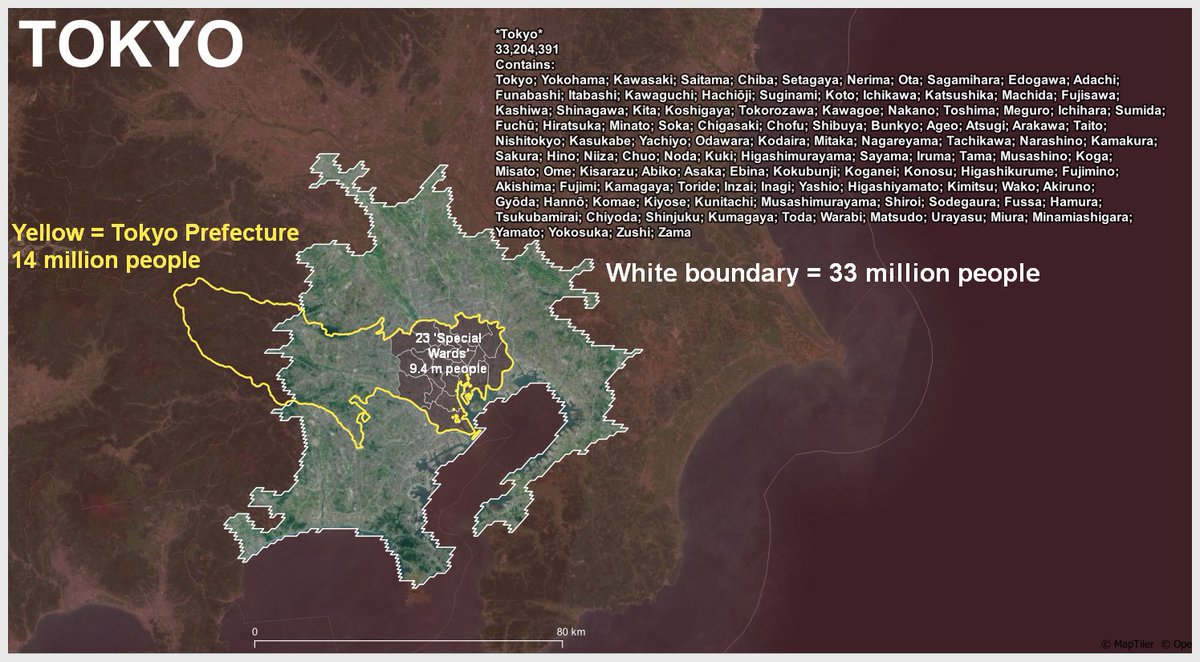
and finally* - here are three different 'Tokyos', but as you can see, the '23 Special Wards' would be too tight a definition for a true 'urban area' population - for comparison, the 23 Special Wards of Tokyo cover 620 sq km and Greater London covers just under 1,600 sq km
*maybe
*maybe
• • •
Missing some Tweet in this thread? You can try to
force a refresh