The effect of election campaigns in spike of Covid19 cases is best shown in the case of Kerala.

After a prolonged spike, cases were decreasing over Feb and early March 2021 in KL. TPR had dropped to around 4%.
Then, tests inexplicably dropped in the last 2 weeks of March.

1/4
The case trajectory started to take a swift turn immediately after April 6th, the date of voting.

✅ Testing started to move up and with it, so did daily cases. Testing > 1L now.
✅ From a 7 day avg. TPR of 5.9% on April 6, 7 day TPR has spiked to 17% as of yesterday.

2/4
✅ Active cases that were just short of 30k on April 6th, has now shot 6 times to 1.18L as of yesterday.

📣 The decreasing trajectory of cases in KL through Feb 2021 and subsequent increase immediately following the election campaign, directly points to the role played....

3/4
....by the election gatherings in the resurgence of Covid19 cases.

📣 The role played by super spreader events in the spread of Covid19 is well documented.
In the larger interest, public gatherings should be avoided till vaccination reaches a certain threshold in India.

4/4

• • •

Missing some Tweet in this thread? You can try to force a refresh
 

Keep Current with covid19indiaorg

covid19indiaorg Profile picture

Stay in touch and get notified when new unrolls are available from this author!

Read all threads

This Thread may be Removed Anytime!

PDF

Twitter may remove this content at anytime! Save it as PDF for later use!

Try unrolling a thread yourself!

how to unroll video
  1. Follow @ThreadReaderApp to mention us!

  2. From a Twitter thread mention us with a keyword "unroll"
@threadreaderapp unroll

Practice here first or read more on our help page!

More from @covid19indiaorg

23 Apr
While we hear and see distressing news on the extreme crunch of medical resources, here is a SILVER LINING:

📣 The vast majority of those who get infected will recover through treatment at home.

Here is a short thread to help you navigate home treatment 👇

1/n
📌 When should I get tested?

(a) Within 2 to 3 days of having Covid19 symptoms. Test slots and reports are getting delayed across cities now, so plan in advance. Do not hesitate.
(b) Came in contact with a Covid19 +ve person: Test 5 days after last contact.

2/n
📌 Not getting a slot for RT-PCR tests and I have symptoms. What should I do?
Consult a doctor. Do not delay getting treatment due to delay in test results. Doctors can advise medication based on symptoms, additional blood tests, medical condition etc.

3/n
Read 13 tweets
20 Apr
On reporting Covid19 deaths - The reported, differently reported and unreported:

Over the past weeks, we've seen multiple reports on differing number of Covid19 deaths.
While we continue to report the official numbers, here are some observations we've made along the way 👇

1/7
📌 Delay in reporting deaths: Skimming through detailed data on deaths released by limited number of states, shows that the reporting of deaths is delayed by days or even weeks. Eg. here is the KA bulletin of 19/04. Take a look at the date of death column.

2/7
📌 Deaths due to non-Covid reasons: Are all deaths of Covid19 +ve persons counted as a Covid19 death? Not in all cases. Few states periodically report deaths due to non-Covid reasons. This is usually determined by a committee that evaluates the cause of death.

3/7
Read 8 tweets
18 Apr
The dangerous spike in weekly TPR over last 2 weeks: Test Positivity Rate (TPR) has jumped to alarming levels across multiple states/UTs this week.
Take a look at the attached analysis that compares TPR between 4th - 10th April and 11th to 17th April 👇

1/5
Notable observations:
✅ CG has recorded a TPR of 29% this week, implying every 3rd person being tested is turning positive.
✅ MH has a high TPR of 24.7% this week, but is the only major state to have shown a decline in weekly TPR compared to last week.

2/5
✅ GA with 23.7% and MP with 19.9%, tails CG and MH wrt TPR this week.
✅ UP has shown a high % increase in weekly TPR, from a low 3.85% from 4 - 10 April to 9.8% from 11 - 17 April. In the same period DL moved from 6.7% to 16.27%.

3/5
Read 5 tweets
15 Apr
Beyond 6ft: Droplets vs. Aerosols

Why are we advised to maintain 6 feet distance for safety? Is there a chance to catch Covid19 even if one is more than 6ft away from an infected person? Why is wearing masks critical?

We explore these questions in this short thread.

1/n
There are 4 main modes of transmission of respiratory viruses:

✅ Contact: Spread through direct contact with an infected person.
✅ Formite: Spread through touching surfaces/objects that carry the virus.
✅ Droplet: Spread through larger droplets exhaled by the person.

2/n Image
✅ Airborne: Spread through smaller droplets that remain suspended in the air over longer distances.

📌 Why 6ft distance?
Respiratory 'droplets' are larger particles that contain the virus. Droplet transmission happens in close proximity, generally within about 6ft.

3/n
Read 6 tweets
3 Apr
Our data team has been hustling on the vaccination data side. Some challenges we've been grappling with:
✅ Multiple data sources - (a) MoHFW/PIB and (b) CoWIN APIs. Primary source?
✅ Data differences between the 2 sources.

So, we have some updates. Read on 👇

1/4
✅ We are tracking CoWIN and MoHFW/PIB updates separately now.
✅ CoWIN data, though behind MoHFW numbers, gives us a richer set of data points to track.

📣 In a significant development, we are now tracking DISTRICT VACCINATION data.
Source - CoWIN APIs.

2/4
📣 Data sourced from CoWIN APIs:

✅ District vaccination data -
api.covid19india.org/csv/latest/cow…

✅ State vaccination data -
api.covid19india.org/csv/latest/cow…

📣 Data from MoHFW/PIB:

✅ National vaccination data - api.covid19india.org/csv/latest/tes…

3/4
Read 4 tweets
18 Mar
MH reported 25.8k new persons with Covid19 today. Highest daily count for the state yet, surpassing 24.8k recorded on 11/09/2020.

How are the 2 spikes different? Few quick points:

➡️ More rapid rise in cases: In Sept. last year, it took a month to double the 7DMA from....

1/5
....10.5k cases/day to a 7DMA of 21k cases/day on 11th September.
Now, it has taken just 12 days for the 7DMA to double from 8k cases/day to 16k cases/day on 17th March.

The 7 day moving avg. graph of MH shows the steep slope for current spike. 👇

2/5
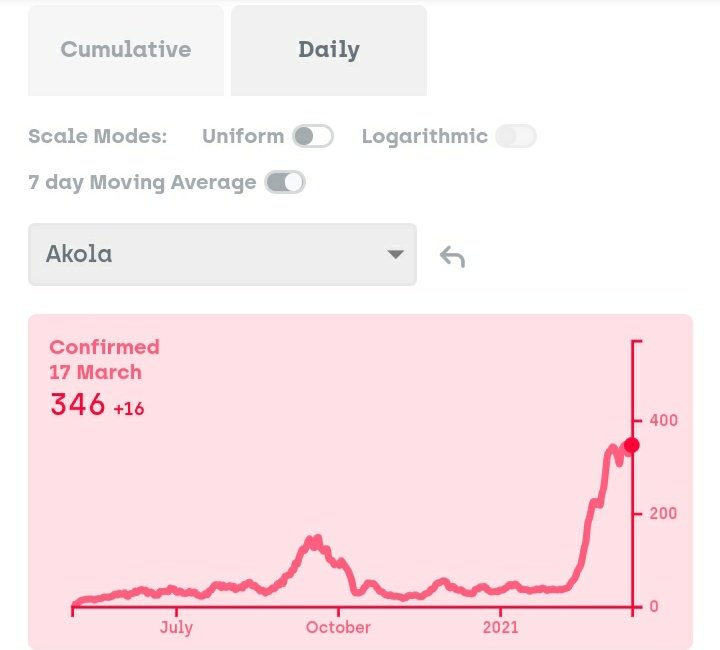
➡️ Larger spike in certain districts: There are a number of districts that are seeing a stronger wave this time than in September last year.

Aurangabad, Akola, Amravati, Buldhana, Nagpur, Nanded, Nashik, Parbhani, Wardha, Washim, Yavatmal: Current case load > Sept. 2020.

3/5
Read 5 tweets

Did Thread Reader help you today?

Support us! We are indie developers!


This site is made by just two indie developers on a laptop doing marketing, support and development! Read more about the story.

Become a Premium Member ($3/month or $30/year) and get exclusive features!

Become Premium

Too expensive? Make a small donation by buying us coffee ($5) or help with server cost ($10)

Donate via Paypal Become our Patreon

Thank you for your support!

Follow Us on Twitter!