A short 🧵on school-age cases.
Firstly to say testing has changed dramatically over the last 6 weeks.
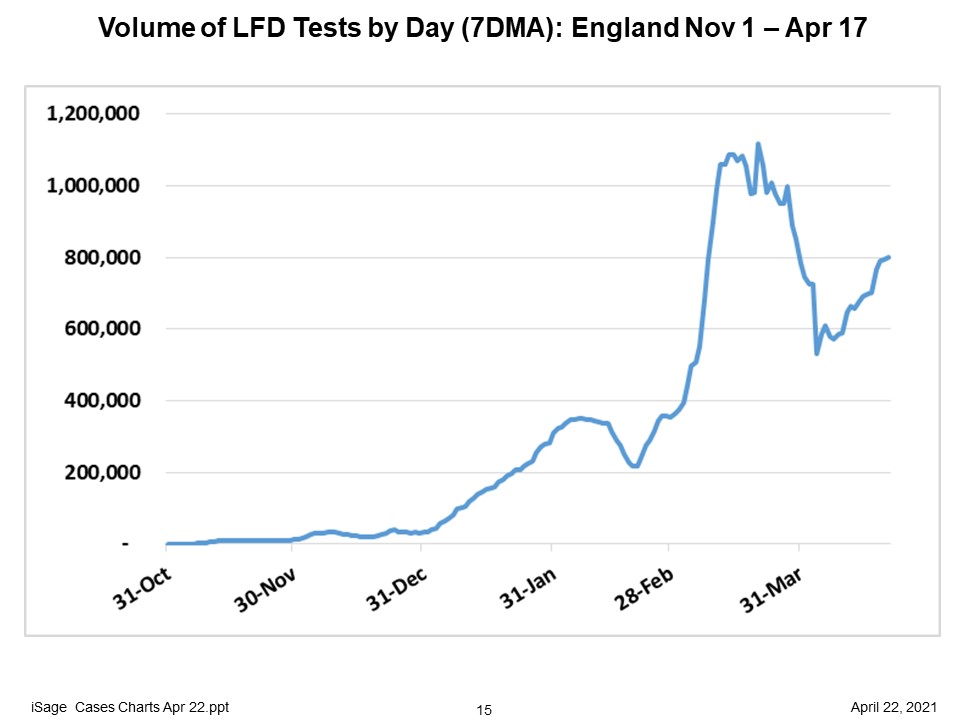
Lateral flow tests shot up prior to the return to schools stayed level for a while and then dropped a little before Easter and have risen since. 1/8
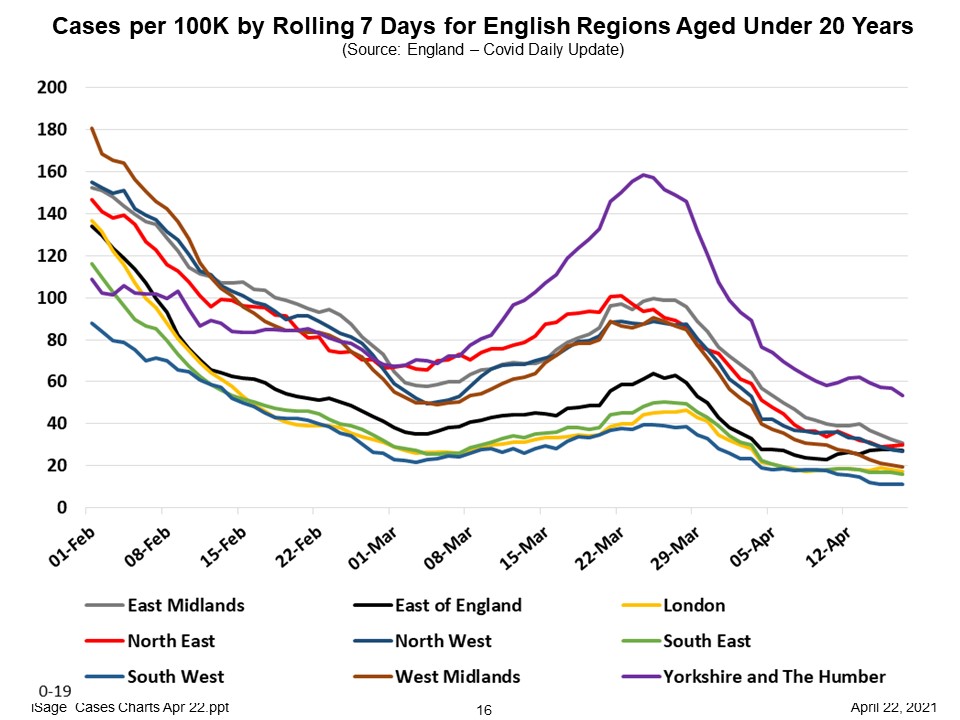
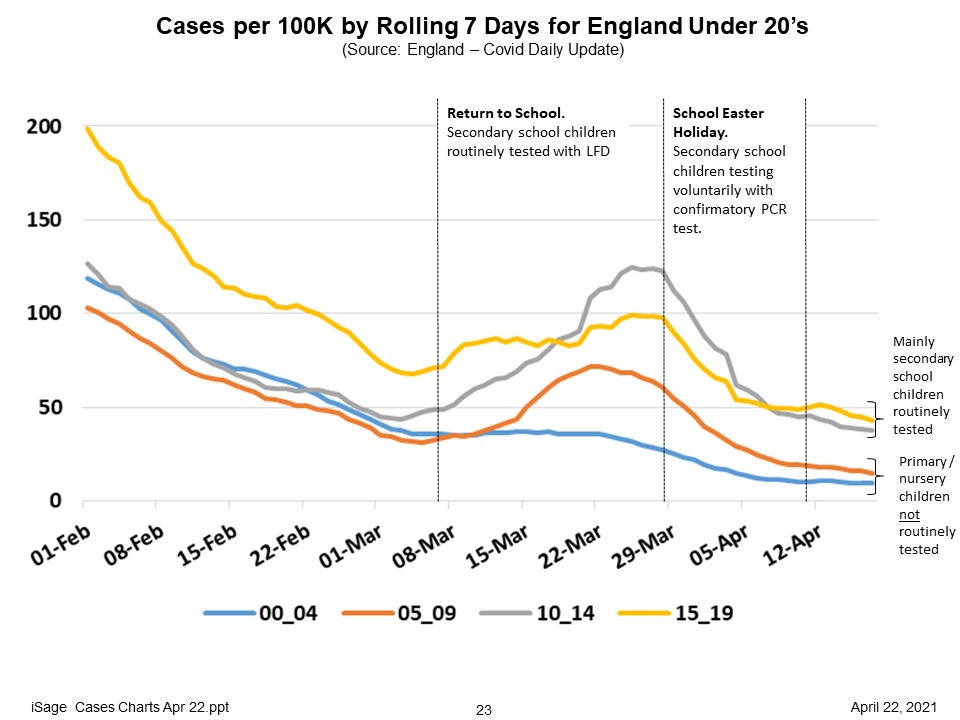
Cases (per 100k) in the under 20s saw big rises upon the return to school in all regions. In fact some cases seemed to stop falling before schools went back consistent with lateral flow tests catching more cases as testing ramped up before the return. 2/8
Drilling down further, roughly the same trend appears in 5-9s, 10-14s and 15-19s.
It wasn't seen in preschool children, but since January they had been attending nursery/pre-school as normal.
So how much of the rise in cases was a result of testing?
Definitely some of it, but...
The rises in positivity in the ONS survey (which uses randomised testing, so takes increases in LFDs out of the equation) illustrate that rises in school age children were genuine and not just a function of testing. 4/8
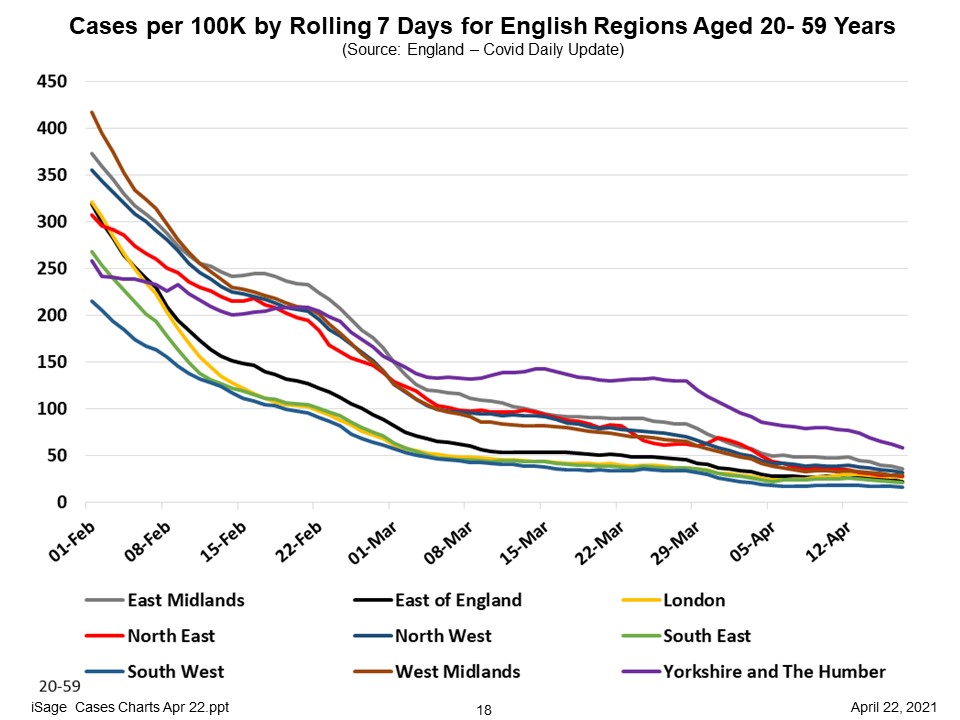
Rises in school age children didn't cause rises in parental-age adults (20-59) although cases did seem to flatten off somewhat over the period when schools returned and then fall again during Easter. Whether as a result of more testing or a genuine levelling off is hard to say...
But it doesn't seem to be there in quite the same way in the ONS positivity rates.
Levelling off is perhaps most evident in 35s-49s the bracket into which the majority of parents of school age children will fall. 6/8
The good news is that, as more adults get vaccinated the less likely we are to see rises in cases in these cohorts even while schools are back.
7/8
Overall its clear that the return to school had an impact on case numbers and positivity in school age children. Fortunately we had Easter as a handy fire-break 3 weeks in.
We'll keep an eye on what's happening over this next 6 week term.
8/8
Thanks to Bob Hawkins for his help in preparing the data.
• • •
Missing some Tweet in this thread? You can try to
force a refresh
A short thread on vaccination data:
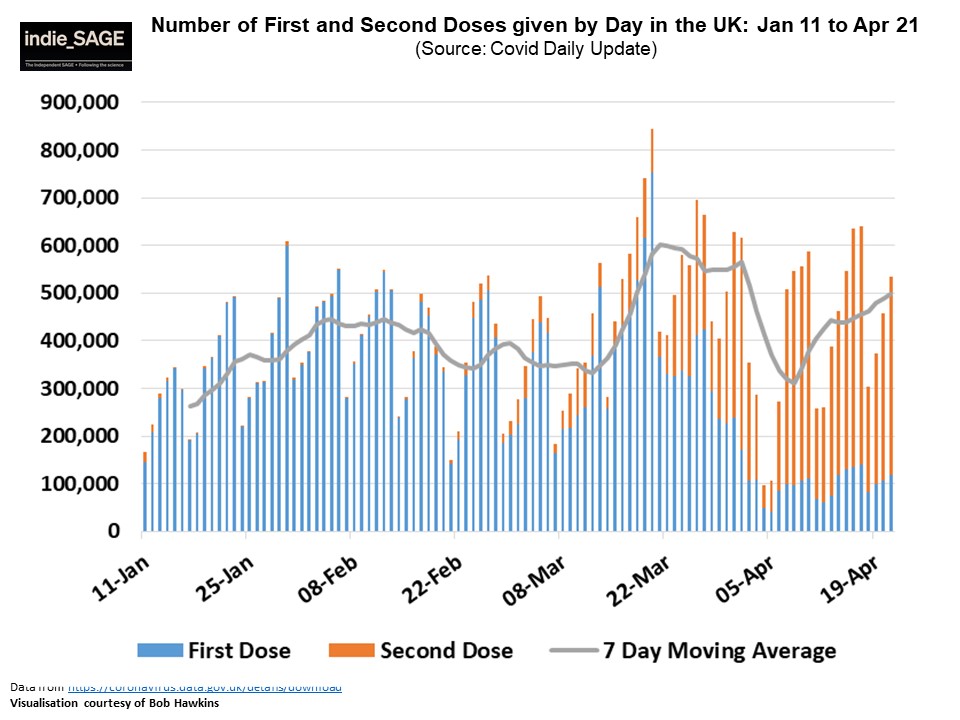
Rate of vaccination is starting to pick up again after a dip earlier in April.
It's still majority second doses being given to keep pace with the first doses we gave 12 weeks earlier. 1/7
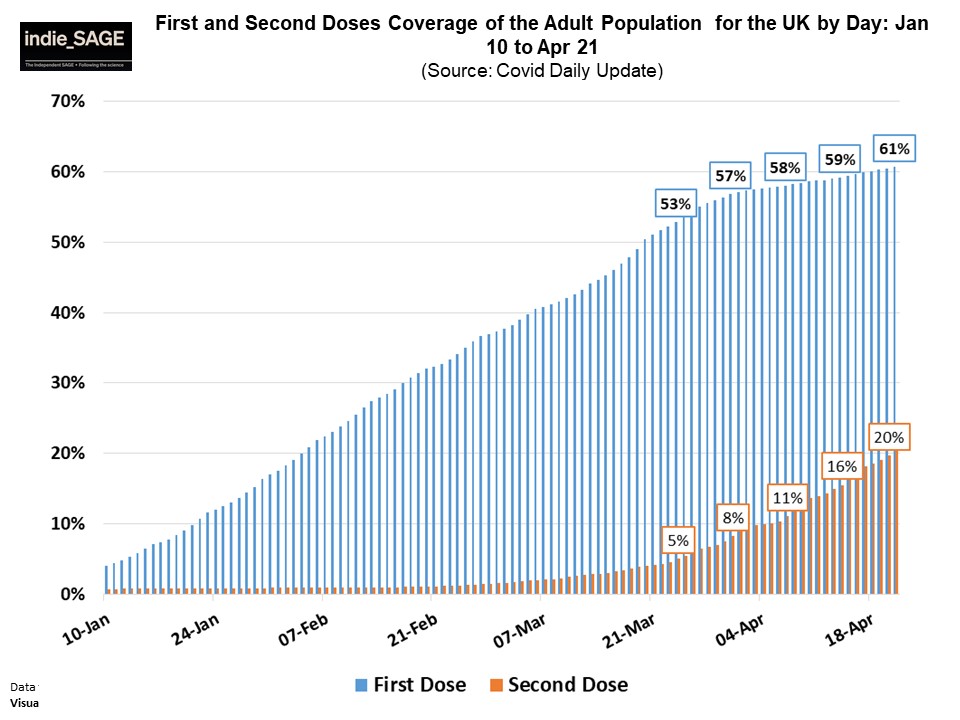
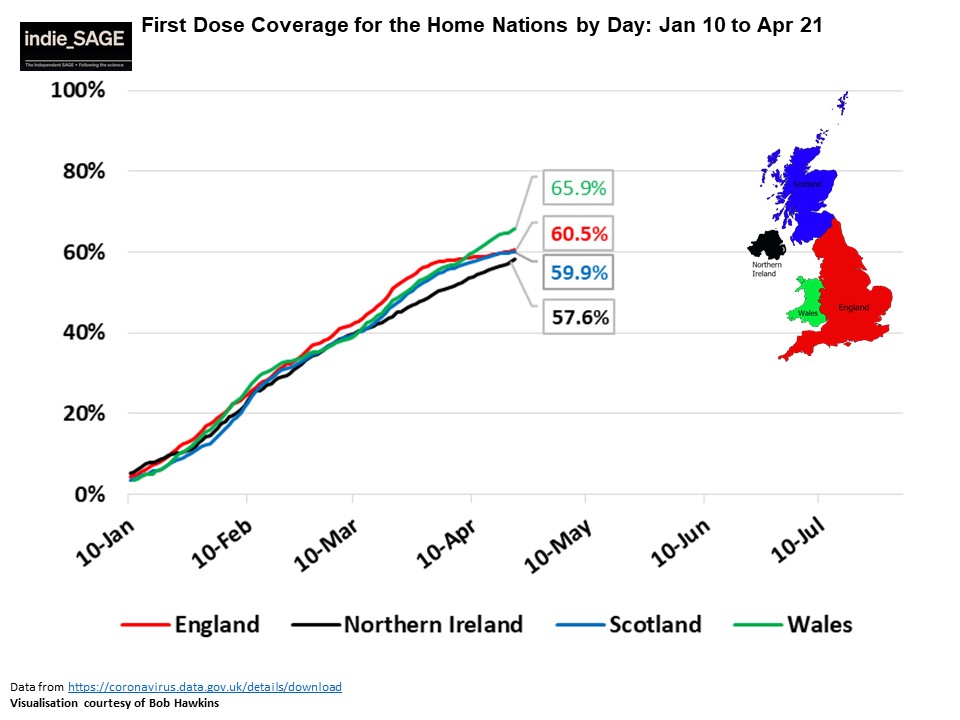
61% of the UK adult population have now had their first dose and 20% their second dose. 2/7
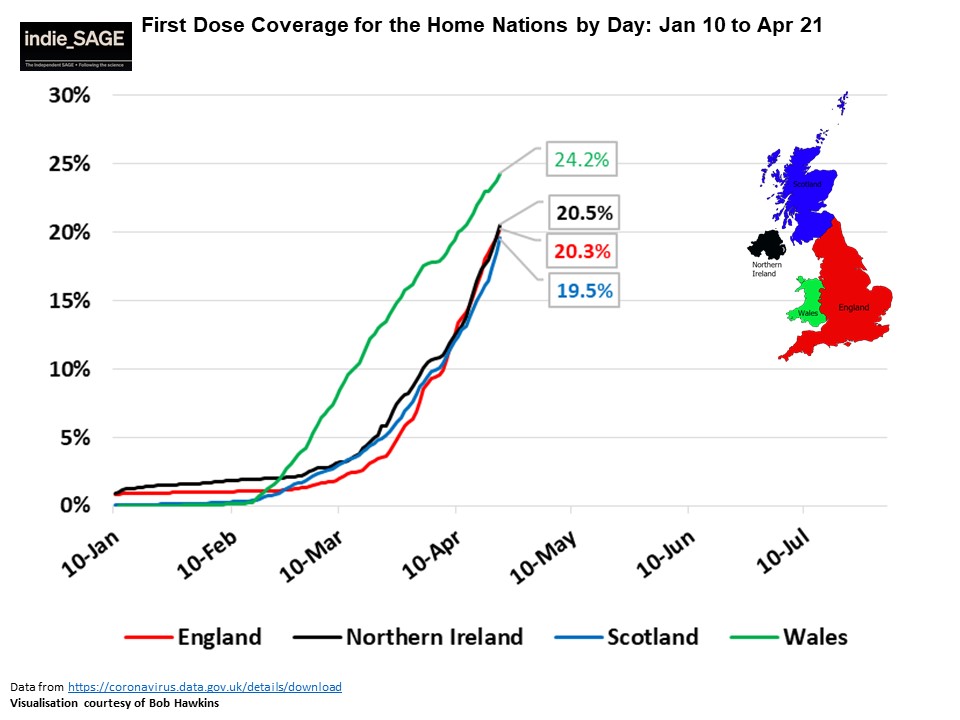
Wales is still ahead with first doses given, while NI lags behind, but the absolute differences in percentages vaccinated are less than 10%.
The relative difference is bigger in second doses with Wales surging ahead early on, but now being pegged back. 3/7
A short thread on variants.
There are a number of cases of variants of concern (VOC) and variants under investigation (VUI) in the UK.
Here I will focus on just four of the most concerning:
P1 - Brazil
B1617 - India
B1351 - South Africa
B1525 - (B117 + E484K mutation).
1/13
The three things we are typically worried about with new variants are 1. Do they spread faster? 2. Do they cause more severe disease/death? 3. Can they evade existing immunity?
I've written a little about the interplay of 1. and 2. here: theconversation.com/coronavirus-va…
2/13
B117 (UK) and P1 (Brazil) have been shown to be more transmissible but it's not yet been definitively established for B1617 (India) or B1351 (SA).
B117 has also been shown to be more deadly, but P1 and B1351 are not thought to be and it's to early to tell with B1617.
3/13
Cases continue to fall week on week in England, Scotland and Wales, while there has been a small up-tick in Northern Ireland, but from a low level.
Not yet back down to September levels, but close. 1/7
The slight up-tick in NI is there in the positivity data (positives/tests taken) but it seems to fall off more recently.
England, Scotland and Wales all showing continued falls in positivity and rates below 2.5%
2/7
Cases continue to fall in all English regions.
(Orange dots in week-on-week plot show this week's rate and grey dots last week's)
Some areas (North West) now below September levels (green diamonds) and others (North East) very close.
TL;DR - Inequality in vaccine uptake exists both as a function of deprivation and ethnicity.
The gaps between the proportions of people in different groups getting vaccinated are getting wider as the vaccine roll out goes on.
1/9
Breaking first dose coverage in the over 50s into quintiles (fifths of the population) by deprivation, there is a clear disparity between uptake in the most deprived areas (83.9%) and the least deprived areas (94.1%).
2/9
Obviously one of the quintiles has to have lowest coverage and one highest, but the clear deprivation gradient (more deprivation correlating with poorer coverage) suggests a clear link between the two.
The trend has been clear for a while, but the gap has been widening over time.
Short 🧵 on case data.
This week sees a big milestone:
All UK Local Authorities have fewer than 100 cases per 100K (7-day rolling average).
TL:DR Generally cases continue to fall in most regions and in most age-ranges, but that doesn't mean this will continue as we open up.
1/9
Cases (per 100K) continue to fall in all home nations. Bigger falls in England and Scotland, smaller in Wales and NI.
All nations are now below 40 per 100K.
Still some way to go before we get back to September levels, but good news.
Cases have fallen in al regions.
Although Yorks & Humber remains the highest cases continue to fall there.
North West nearly back to its (albeit highest of all regions) September level. Some others getting close but others still some way off.
A short thread on case positivity data.
Overall case positivity has continued to fall across all regions and in the majority of local authorities.
Lets hope positivity rates continue to fall after this latest round of opening up.
All home nations are continuing to show falls in positivity and are now well below the 5% threshold recommended by the WHO.
Similarly positivity continues to fall in all English regions and all are now below 3%.
Yorkshire and the Humber continuing to be a bit of an outlier, but positivity is coming down nevertheless.