A short thread on variants.
There are a number of cases of variants of concern (VOC) and variants under investigation (VUI) in the UK.
Here I will focus on just four of the most concerning:
P1 - Brazil
B1617 - India
B1351 - South Africa
B1525 - (B117 + E484K mutation).
1/13
There are a number of cases of variants of concern (VOC) and variants under investigation (VUI) in the UK.
Here I will focus on just four of the most concerning:
P1 - Brazil
B1617 - India
B1351 - South Africa
B1525 - (B117 + E484K mutation).
1/13
The three things we are typically worried about with new variants are
1. Do they spread faster?
2. Do they cause more severe disease/death?
3. Can they evade existing immunity?
I've written a little about the interplay of 1. and 2. here: theconversation.com/coronavirus-va…
2/13
1. Do they spread faster?
2. Do they cause more severe disease/death?
3. Can they evade existing immunity?
I've written a little about the interplay of 1. and 2. here: theconversation.com/coronavirus-va…
2/13
B117 (UK) and P1 (Brazil) have been shown to be more transmissible but it's not yet been definitively established for B1617 (India) or B1351 (SA).
B117 has also been shown to be more deadly, but P1 and B1351 are not thought to be and it's to early to tell with B1617.
3/13
B117 has also been shown to be more deadly, but P1 and B1351 are not thought to be and it's to early to tell with B1617.
3/13
In terms of evading immunity, it seems that B117 (UK) is not very good at this, but B1351 (SA) is, as is P1 (Brazil) (although less so than B1351). It also seems likely that B1617 (India) may be able to evade existing immunity.
4/13
4/13
With regards to the above summary I will stress, I am not a virologist.
@EricTopol gives a nice summary of what is and what isn't known about the different variants here:
5/13
@EricTopol gives a nice summary of what is and what isn't known about the different variants here:
https://twitter.com/EricTopol/status/1383107879058608129?s=20
5/13
Perhaps of most concern to the UK right now are variants which can evade existing immunity. They threaten to undo the good work we have done with the vaccination programme so its important we keep track of them.
Warning - the data is not super clear.
6/13
Warning - the data is not super clear.
6/13
These data come from COG - COVID-19 genomic consortium - who are sequencing samples of the virus.
Since all positive-testing samples from incoming travellers are being sequenced it is unlikely that these numbers are representative of the UK population
cogconsortium.uk
7/13
Since all positive-testing samples from incoming travellers are being sequenced it is unlikely that these numbers are representative of the UK population
cogconsortium.uk
7/13
This chart shows week on week absolute numbers of variants (up to 11 April).
B1617 (India) has become the most sequenced (apart from B117) in the last couple of weeks over taking B1351 (SA).
Clearly the number of sequences carried out affect these numbers significantly.
8/13
B1617 (India) has become the most sequenced (apart from B117) in the last couple of weeks over taking B1351 (SA).
Clearly the number of sequences carried out affect these numbers significantly.
8/13
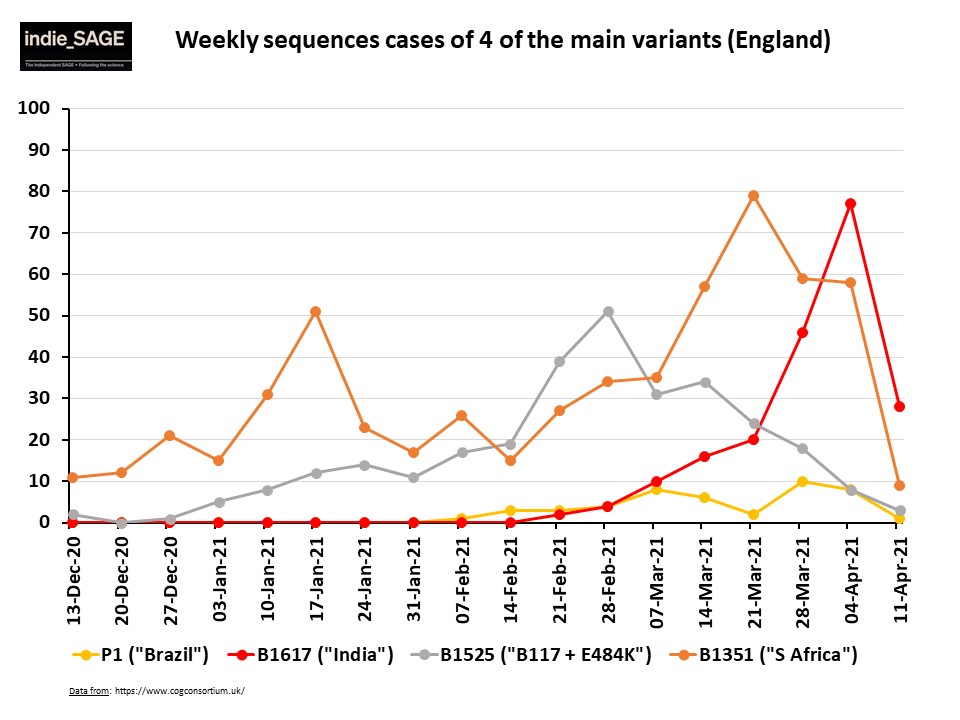
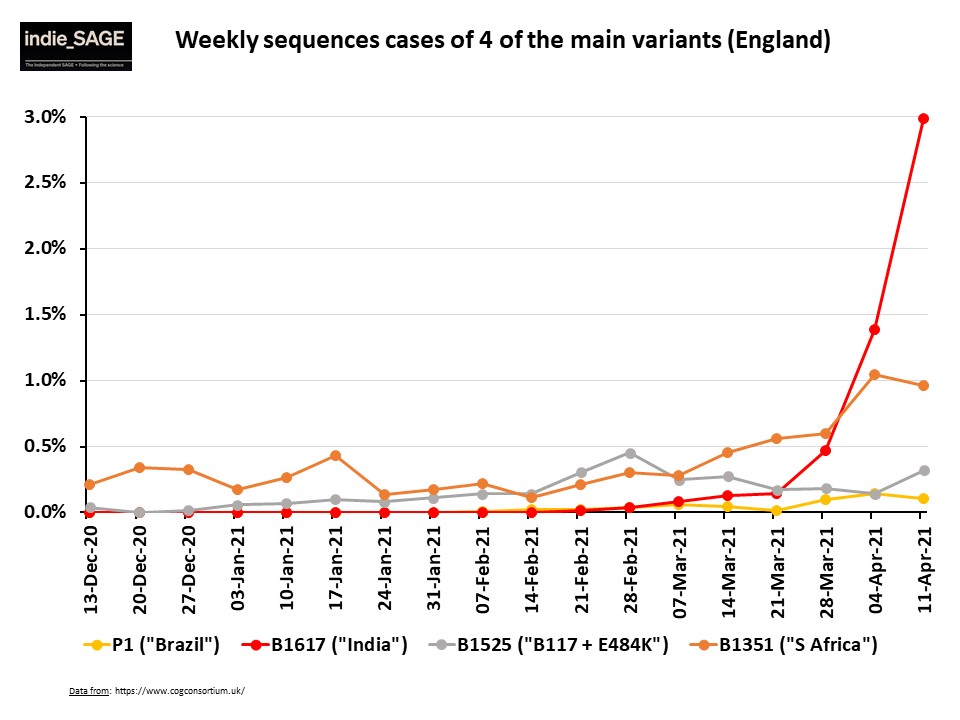
Perhaps it's more informative to look at proportions of variant sequenced to control for absolute numbers. This clearly shows the B1617 (India) variant growing in proportion (nearly 3% of all sequences) and B1351 (SA) only decreasing mildly, with P1 and B117+E484K struggling
9/13
9/13
Hard to draw firm conclusion from these data because they are probably not representative of transmission in the community. Likely to be a strong bias towards sequences from incoming travellers.
Rises in the B1617 might just reflect horrifying rises we are seeing in India.
10/13
Rises in the B1617 might just reflect horrifying rises we are seeing in India.
10/13
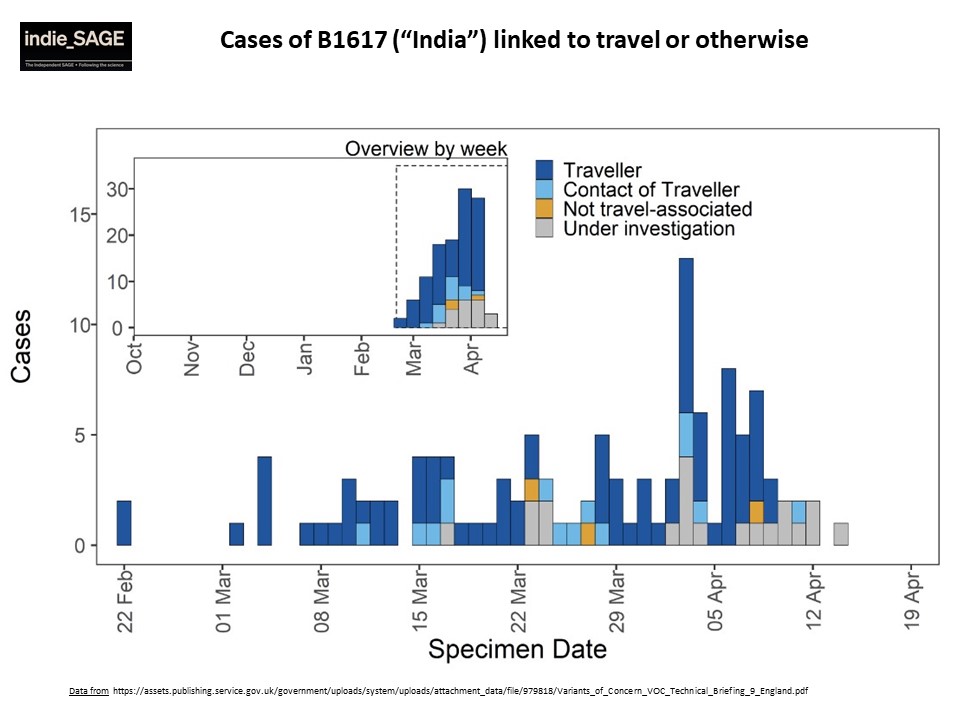
This chart from PHE shows whether cases of B1617 (India) are related to travel or not. The majority are travellers or contacts of travellers.
Three have no links to travel and a number of others are "under investigation".
11/13
Three have no links to travel and a number of others are "under investigation".
11/13
What is clear is that we do not want to allow any of these variants to gain a foothold in the UK lest we risk them undermining the vaccine programme.
Adding India to the red list this morning will make a difference to how many cases of B1617 we see but ...
12/13
Adding India to the red list this morning will make a difference to how many cases of B1617 we see but ...
12/13
B1617 is still only a variant under investigation, meaning cases do not automatically trigger surge testing.
If we insist on waiting to know for certain whether a variant is classified as a “variant of concern”, by the time we find out it is, it may really be a concern.
/ENDs
If we insist on waiting to know for certain whether a variant is classified as a “variant of concern”, by the time we find out it is, it may really be a concern.
/ENDs
• • •
Missing some Tweet in this thread? You can try to
force a refresh

