How do we approximate labor values from input-output tables? A short thread on the methodology behind Güney Işıkara's and my paper on market prices, labor values and the empirical strength of the labor theory of values. (1/N)
You can find the paper here: tandfonline.com/doi/citedby/10…
You can find the paper here: tandfonline.com/doi/citedby/10…
Input-Output Tables (IOTs) record financial flows between industries. How many dollars did industry B spend on products from industry A?
This allows us to trace *relative* flows. How many percent of industry A outputs "travel" as inputs through industry B to industry C? (2/N)
This allows us to trace *relative* flows. How many percent of industry A outputs "travel" as inputs through industry B to industry C? (2/N)
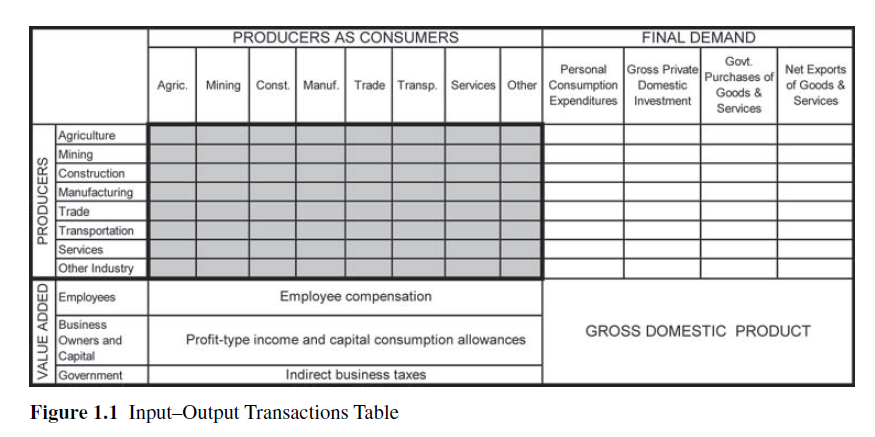
This is the I x J matrix Z, where z(ij) is the flow of payments from i to j and the commodity flow from j to i.
The column sums of Z give I-entry gross output vector X.
If we "divide" flows by output (matrix multiply Z *(diag(X))^(1)), we get the normalized flow matrix A. (3/N)
The column sums of Z give I-entry gross output vector X.
If we "divide" flows by output (matrix multiply Z *(diag(X))^(1)), we get the normalized flow matrix A. (3/N)
Matrix A expresses the intuition from above: How much of B's inputs come from which industry? Now we want to watch labor *costs* (not values) travel through the industries.
Thus, we record labor expenses for each industry, normalize by average wage to correct for skills. (4/N)
Thus, we record labor expenses for each industry, normalize by average wage to correct for skills. (4/N)
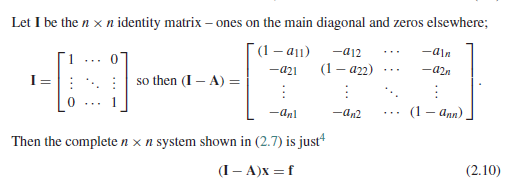
So the labor cost embodied in the output of industry A are the labor cost in that industry, plus the labor cost of industry B times the share of B's output going to A, and the labor costs from C going to B, and so on. This is expressed in the Leontief inverse. (5/N)
When I is the identity matrix (a matrix where the only non-zero entries are on the diagonal, and they are all 1), the Leontief Inverse is (I - A)^(-1).
The LI is an expression for the sum of a series A + A^2 + A^3 + ..., which in turn records the flows through the IOTs. (6/N)
The LI is an expression for the sum of a series A + A^2 + A^3 + ..., which in turn records the flows through the IOTs. (6/N)
So we multiply this labor vector with the Leontief Inverse l(I-A)^(-1) = v, the labor vector.
To make it commensurable with market prices, we must bring it back to monetary terms. So we normalize it by the ratio of total values to total output, ie. sum(v * x)/sum(x).
(7/N)
To make it commensurable with market prices, we must bring it back to monetary terms. So we normalize it by the ratio of total values to total output, ie. sum(v * x)/sum(x).
(7/N)
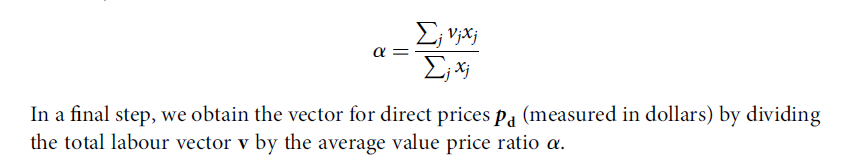
This gives us "direct prices" pd = v * (sum(x*v)/sum(x)).
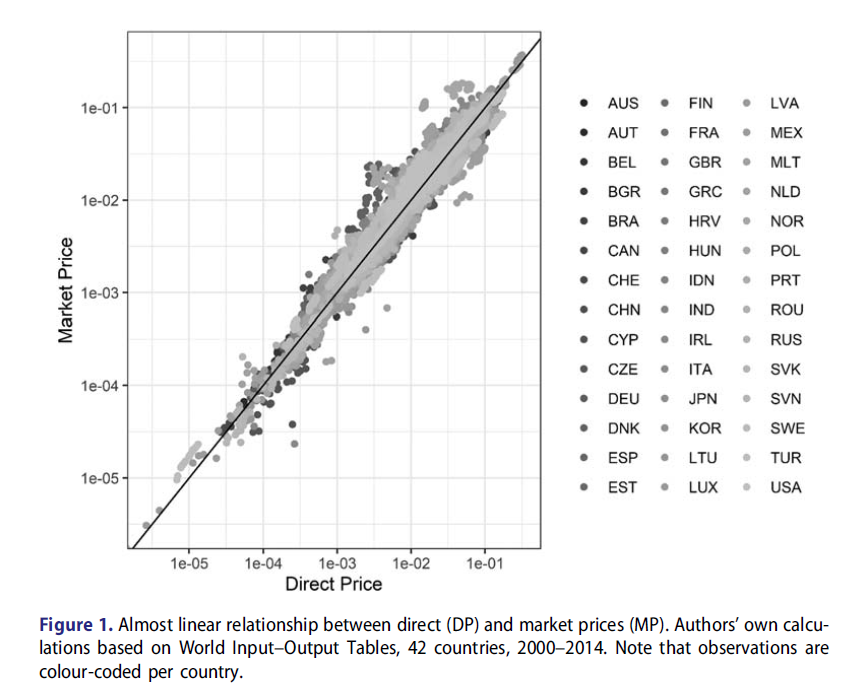
We compare direct prices with market prices of each industry, ie. how many dollars were paid for products of this industry, compared to aggregate dollar payments.
And alas, the relationship is *almost linear*. (8/N)
We compare direct prices with market prices of each industry, ie. how many dollars were paid for products of this industry, compared to aggregate dollar payments.
And alas, the relationship is *almost linear*. (8/N)
To understand the method, I'd recommend reading Miller and Blair's "Input-Output Analysis", the Appendix to @shaikhecon's "The empirical linearity of Sraffa's critical output-capital ratios", and App A to Torres-Gonzalez and Chang's "The Persistent Statistical Structure..." (9/N)
Pictures in Thread:
- Miller and Blair 2009, Fig. 1.1
- ibid., p20
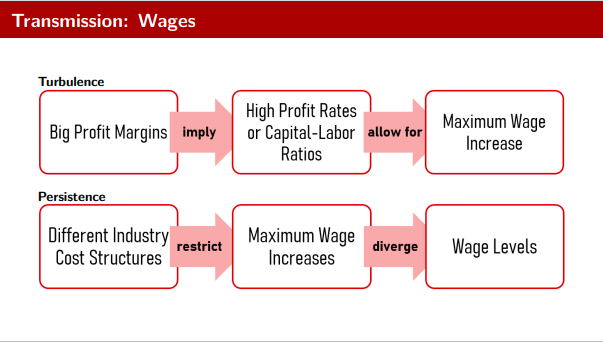
- Işıkara and Mokre, 2021, p5
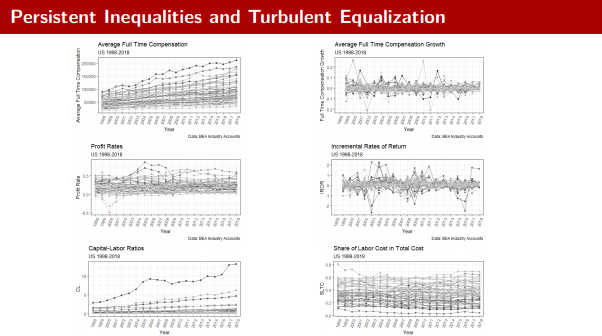
- ibid. Fig. 1
(10/N)
- Miller and Blair 2009, Fig. 1.1
- ibid., p20
- Işıkara and Mokre, 2021, p5
- ibid. Fig. 1
(10/N)
• • •
Missing some Tweet in this thread? You can try to
force a refresh