On Saturday, I will present my working paper to the 9th @ecineq Meeting. Its my 2nd dissertation chapter on the role of firm competition in wage inequality.
It is my first ECINEQ presentation, so I am honored and excited!
ecineq2021.org/sessions/i7-wa…
#ecineq2021 #econtwitter
It is my first ECINEQ presentation, so I am honored and excited!
ecineq2021.org/sessions/i7-wa…
#ecineq2021 #econtwitter
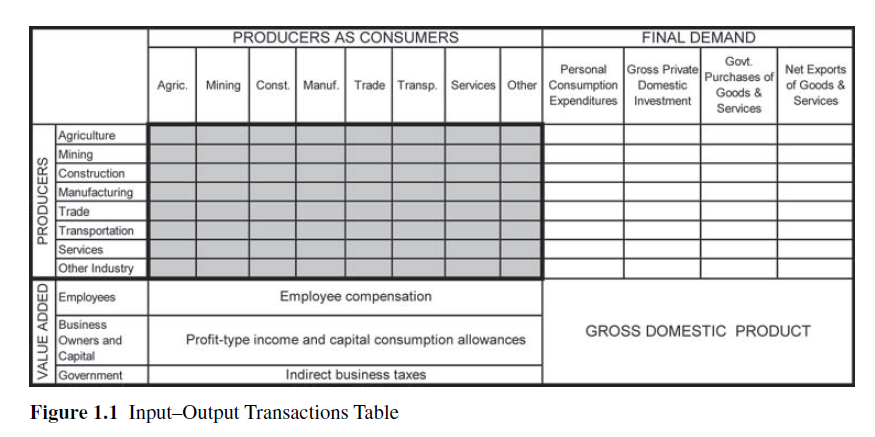
I link turbulent competition between firms and turbulent dynamics of wage increases, roughly following Marx’ intuition: “The competition between workers is only another form of the competition among capitalists.” (Grundrisse, p. 651 in the 1999 Penguin Edition)
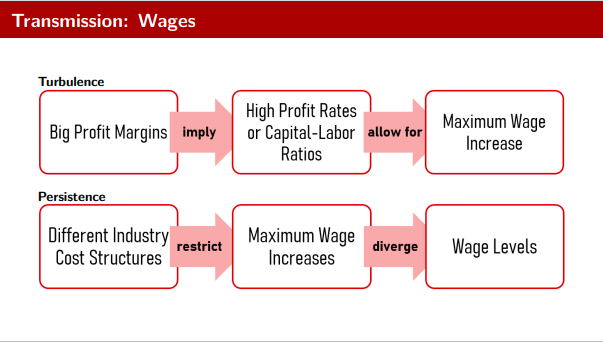
The intuition is that the same structural differences between industries which define firm competition, ie. capital structure and cost structure, also define maximum limits to wage increases.
Over time, these manifest in industrial wage inequality.
Over time, these manifest in industrial wage inequality.
Since income inequality is inherently distributional, I estimate the impact over the full wage curve, using quantile regression.
There is no reason to believe the same mechanisms apply to low and high wage groups equally, the methods allows me to identify the differentials.
There is no reason to believe the same mechanisms apply to low and high wage groups equally, the methods allows me to identify the differentials.
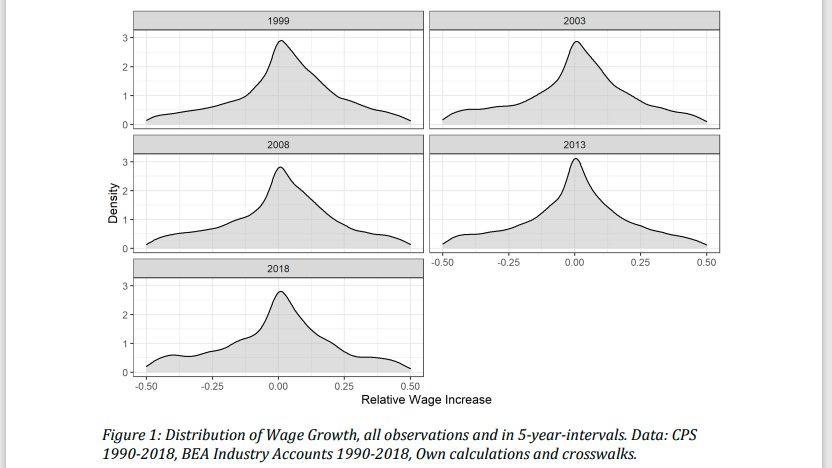
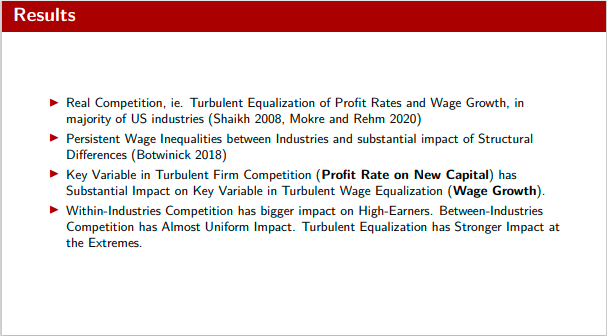
I find (1) wage growth follows turbulent patterns, like profit rates (2) competition within industries stronger affects higher wages (3) competition between industries has a stronger impact at median wages (4) turbulent profit rate equalization is most effective at the extremes.
Wage inequality is a bit of a puzzle. Especially when we look at extreme examples, like inter-industry inequality: Why would two people with the same occupation, education and demography earn different wages in the steel or paper industry?
Many economists treat wages as some sort of reward: 1 more year of education or 2 more percentage points of productivity get you an additional thousand dollars per year.
But that’s not how wages are decided. You don’t sit down with your boss and allot dollar values to your CV.
But that’s not how wages are decided. You don’t sit down with your boss and allot dollar values to your CV.
This would be fine if the model worked well. But it seems as if the same CV assets get you different rewards, depending on *who writes the check*.
So instead, some researchers ask the question: What if not workers’ characteristics, but bargaining with employers define wages?
So instead, some researchers ask the question: What if not workers’ characteristics, but bargaining with employers define wages?
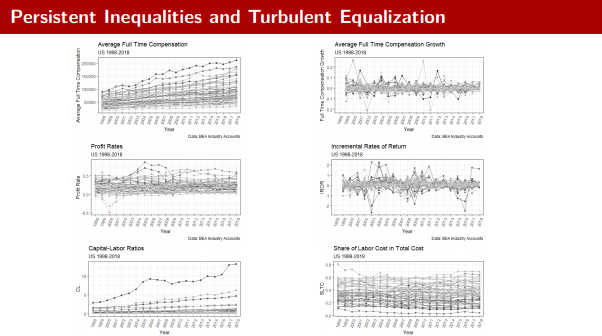
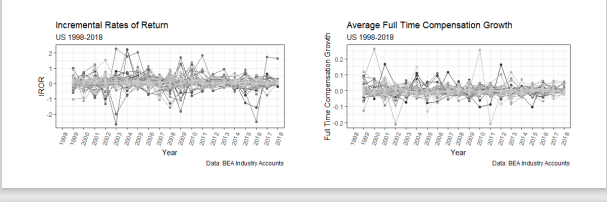
One important piece of evidence is that in a majority of industries, wage increases follow the same turbulent pattern as profit rates on new capital.
These "regulating profit rates" are the focal points of capital mobility (investment).
These "regulating profit rates" are the focal points of capital mobility (investment).
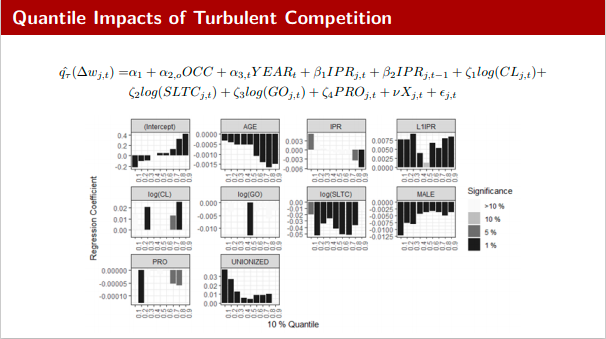
Botwinick (2018 [1993]) derives limits to wage increases from competition between industries (capital-labor ratio) and within industries (share of labor cost in total cost). Indeed, these are significant & substantial covariates for wage levels, in the aggregate and in microdata.
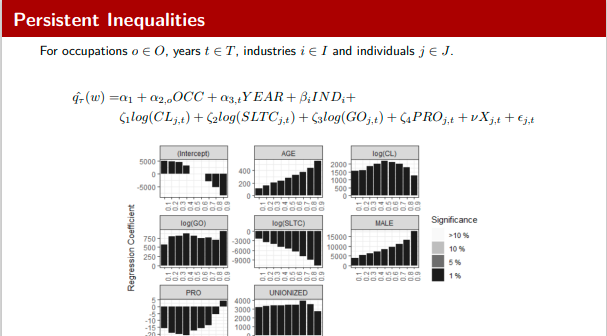
Finally, my hypothesis is that the turbulent aspect of competition serves as the link between competition and wage growth. Indeed, the rate of profit on new capital ("IPR" in the figure) is significant, substantial and positive to percentage wage increases.
Find the Work in Progress on my homepage, and please let me know what you think!
portfolio.newschool.edu/mokrp960/2021/…
portfolio.newschool.edu/mokrp960/2021/…
• • •
Missing some Tweet in this thread? You can try to
force a refresh