
Principal Component Analysis is one of the most fundamental techniques in data science.
Despite its simplicity, it has several equivalent forms that you might not have seen.
In this thread, we'll explore what PCA is really doing!
🧵 👇🏽
Despite its simplicity, it has several equivalent forms that you might not have seen.
In this thread, we'll explore what PCA is really doing!
🧵 👇🏽
PCA is most commonly introduced as an algorithm that iteratively finds vectors in the feature space that are
• orthogonal to the previously identified vectors,
• and maximizes the variance of the data projected onto it.
These vectors are called the principal components.
• orthogonal to the previously identified vectors,
• and maximizes the variance of the data projected onto it.
These vectors are called the principal components.

The idea behind this is we want features that convey as much information as possible.
Low variance means that the feature is more concentrated, so it is easier to predict its value in principle.
Features with low enough variances can even be omitted.
Low variance means that the feature is more concentrated, so it is easier to predict its value in principle.
Features with low enough variances can even be omitted.
However, there is an alternative approach.
Check out our simple dataset below. The features are not only suboptimal in terms of variances but they are also correlated!
If 𝑥₁ is small, 𝑥₂ is large. If 𝑥₁ is large, 𝑥₂ is small. One holds information about the other!
Check out our simple dataset below. The features are not only suboptimal in terms of variances but they are also correlated!
If 𝑥₁ is small, 𝑥₂ is large. If 𝑥₁ is large, 𝑥₂ is small. One holds information about the other!

This is suboptimal. In real dimensional datasets having thousands of features, getting rid of the ones that contain no new information makes our job easier.
So, let's decorrelate the features!
So, let's decorrelate the features!
Since the covariance matrix is real and symmetric, the spectral decomposition theorem says that we can diagonalize it with orthogonal matrices.
(See the spectral theorem: en.wikipedia.org/wiki/Symmetric…)
(See the spectral theorem: en.wikipedia.org/wiki/Symmetric…)

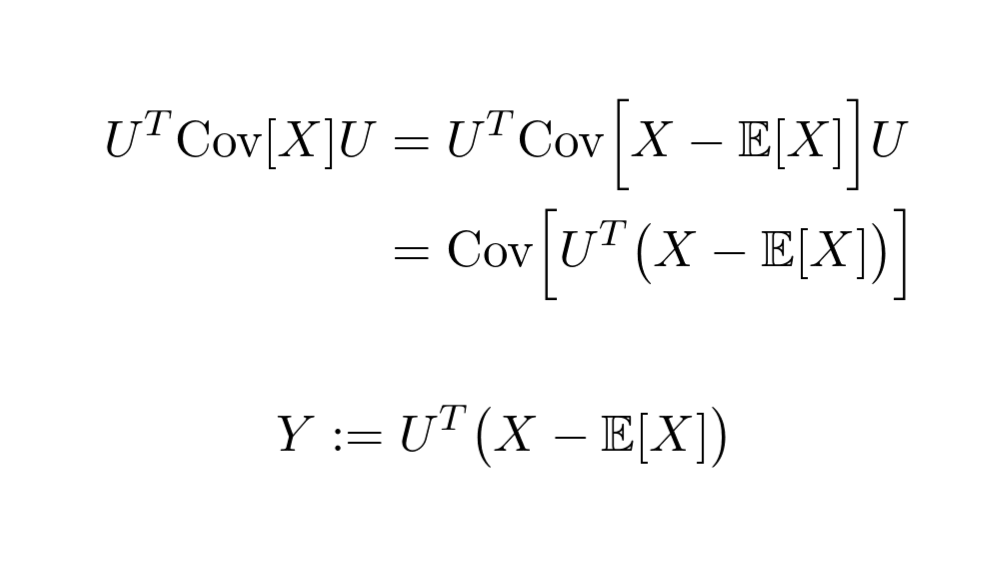
Due to the properties of covariance, we can see that the diagonalized covariance matrix is the covariance matrix of a transformed dataset!
Moreover, it turns out that the row vectors of 𝑈 are the principal components!
Moreover, it turns out that the row vectors of 𝑈 are the principal components!
This is how the dataset looks after the transformation.
Due to its construction, the features of 𝑌 are uncorrelated. The spectral decomposition theorem also guarantees that the k-th feature is orthogonal to the ones before it and maximizes the variance of the projected data.
Due to its construction, the features of 𝑌 are uncorrelated. The spectral decomposition theorem also guarantees that the k-th feature is orthogonal to the ones before it and maximizes the variance of the projected data.

This is PCA in broad strokes. If you are interested in the finer details, I have written a blog post about it. Check it out!
towardsdatascience.com/understanding-…
towardsdatascience.com/understanding-…
If you enjoyed this explanation, consider following me and hitting a like/retweet on the first tweet of the thread!
I regularly post simple explanations of seemingly complicated concepts in machine learning, make sure you don't miss out on the next one!
I regularly post simple explanations of seemingly complicated concepts in machine learning, make sure you don't miss out on the next one!
https://twitter.com/TivadarDanka/status/1387399961143353347
• • •
Missing some Tweet in this thread? You can try to
force a refresh


