THREAD - MOAR ARK: @EricBalchunas recently noted $PATH now shows up as being owned across ALL 6 ARK active ETFs:
This brings up a v important topic that I only touched on briefly in prior threads re: ARK ETF Position Overlap/Correlation. Let's dig in...
https://twitter.com/EricBalchunas/status/1387013771722375169?s=20
This brings up a v important topic that I only touched on briefly in prior threads re: ARK ETF Position Overlap/Correlation. Let's dig in...
2/Buried deep in the last super long thread were 2 correlation tables showing ARK active ETFs from Jan'20 and Dec'20 thru this year:
Long story short: ARKK/G/F/Q/W are all highly correlated, esp in recent months post-massive '20 inflows/AUM explosion...
https://twitter.com/ttp_cap/status/1384614613447233537?s=21
Long story short: ARKK/G/F/Q/W are all highly correlated, esp in recent months post-massive '20 inflows/AUM explosion...
3/In that thread I also noted 35-45% position overlap across those ETFs. I was referring ONLY to the Avg overlap b/w 1 active ETF and any other. The real position overlap across ALL ARK Active ETFs is in fact way higher - OVER 70%. It's this point that I want to dive into here...
4/To illustrate, I'll show a few tables (all data as of 4/23/21). The first is just a matrix of the 6 active ETFs w/total position count in the far left column. Each subsequent column shows overlap w/the other ETFs. Here is the table: 

5/To clarify, $ARKK has 58 total positions, $ARKW 54, $ARKQ 49 etc. $ARKK has 30 positions that overlap w/ $ARKW, 15 positions that overlap w/ $ARKQ, etc. In total ARK has 306 positions across all 6 Active ETFs, including the newly launched $ARKX.
6/The next table puts that position overlap into context as a % of the total for each ETF. As you can see from this table, $ARKK has 52% position overlap w/$ARKW, 26% w/$ARKQ, 40% w/$ARKG, etc. Here's the table:

7/What's interesting about these last 2 tables imo is not the overlap b/w $ARKK and the other ETFs, but the overlap you see b/w the others amongst themselves. eg $ARKW (Next Generation Internet) and $ARKF (Fintech Innovation) have exceptionally high overlap...
8/Per the table, 44% of all the positions in $ARKW show up in $ARKF. Likewise, 52% of all of $ARKF's positions are in $ARKW. Now look at $ARKQ and the newly minted $ARKX. 60% of all the positions in $ARKX are ALREADY IN $ARKQ!
9/Now let's look at all these ETFs based not on position count, but on $ of gross exposure by position. Here is a simple table similar to the first one which shows total $ Investments broken down by ETF (left column) against gross $ overlap of positions vs the other ETFs:

10/To clarify that table: $ARKK as of 4/23 had $24bn of AUM; the 30 positions that overlapped b/w $ARKK & $ARKW accounts for $17.1bn of $ARKK's total AUM. Likewise, those 30 overlapping positions = $4.6bn of exposure for $ARKW out of its total of $6.8bn AUM...
11/Next is a table that shows what that matrix looks like in % terms of total reported gross investment dollars per ETF. As you can see from this table, the $17.1bn of $ARKK position overlap w/$ARKW represents 71% of all of $ARKK's gross. Here is the table:

12/Let's dig into this vs the pos count overlap table. One thing that strikes u is that while position overlap is obviously high, the $ gross exposure overlap is in some cases EVEN HIGHER. eg $ARKK vs $ARKW: 52% of $ARKK's positions overlap w/ARKW, but that's 71% of gross $$...
13/Said another way, just looking at the overlap of underlying tickers (which is already high) can understate just how much actual overlap there is b/w the different ETFs. This is obviously a function of the fact that many of the overlapping positions are ARK's BIGGEST ones.
14/Think about this conceptually for the newest ETF - $ARKX: if you buy this ETF to get exposure to "Space Exploration" you're really getting 60% position overlap with and 57% of your gross exposure coming from "Autonomous Technology & Robotics" ($ARKQ).
15/The same is true if u buy $ARKF to get "Fintech Innovation" exposure; ur really getting 52% pos overlap with and 66% of your gross exposure coming from "Next Generation Internet" ($ARKW). All of which helps explain why correlation bw ARK ETFs is so high, per the prior thread.
16/This last table shows Total Positions by ETF in the 2nd column, followed by Overlapping Positions in col 3, Unique Positions in col 4, & % overlap of the entire ETF in the last column. As you can see, 100% of $ARKK's positions are in other ARK ETFs. Here's the table:

17/Per that table, of the 306 positions across all 6 active ARK ETFs, only 87 are unique to 1 ETF, while 219 of them (72%) overlap w/at least 1 other ARK ETF. $ARKW is obv the least diversified of the single theme ETFs w/80% overlap, while $ARKG has the lowest overlap (41%)...
18/So what does all this mean? The simple answer is CORRELATION, as we have already discussed in prior threads: in order to analyze ARK (including looking at fund flows), you have to look at the active ETFs in aggregate bc they are all tightly intertwined...
19/This further bolsters the hypothesis that '20 outperformance was in large part driven by unprecedented aggregate inflows to ARK ETFs. W/so much position/gross $ exposure overlap, as funds flowed into one ARK ETF, that ETF was passively buying stocks held by the other ARK ETFs.
20/When funds are flowing IN, the cycle is quite virtuous for the performance of all the ETFs in the ARK family, as we have seen. The problem, as always, is that this same reflexivity works in reverse as well. As the song goes: "If we go down, we all go down together..."
21/My other thread highlighted the late Feb/early March drawdown period for ARK when we saw exactly this happen. All it took was a slowdown and then modest reversal in fund flows to the ARK ETFs:
https://twitter.com/ttp_cap/status/1384618769184608256?s=21
22/Per the chart in that old post, $ARKK actually suffered the largest drawdown of any of the ARK active ETFs during that period. What's interesting, however, is that the change in fund flows for $ARKK were less dramatic than the other "thematic" ARK ETFs...
23/Here's a chart that shows 5-day rolling inflows & outflows as a % of prior 5-day AUM for each ETF. What you can see from this chart is that Inflows as a % of AUM were much greater for ARKF/G/W/Q than $ARKK for most of this period. Here's the chart:
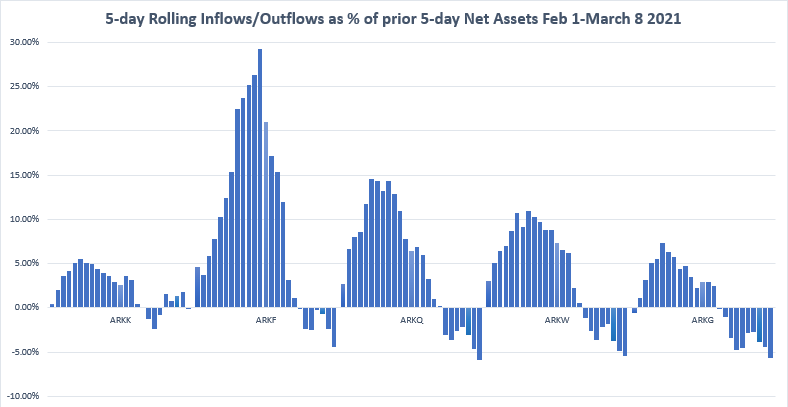
24/At the peak on Feb 17, $ARKF had a 5 day run of inflows equal to ~30% of its AUM only 5 trading days prior! That is, $ARKF had $3.6bn of net assets on Feb 9 and then saw $1.1 billion of new money pour into it over the next 5 days alone. Crazy, right?
25/$ARKW and $ARKQ for their part were taking in 10-15% of their asset base in new subscriptions during this same period, while $ARKG peaked at 7.3%. Likewise, when $ started flowing out on Feb 23, the thematic ETFs actually saw bigger redemptions than $ARKK.
26/By March 8, ARKQ/W/G/F all saw 5-6% of their AUM get redeemed on a rolling 5-day basis, while the flagship $ARKK’s 5-day redemptions peaked at only 1/2 that amount and even REVERSED (seeing inflows) in early March.
27/Yet as we know $ARKK’s performance was the worst of the bunch over that period. Why? Simple – position overlap and correlation. Go back to all those correlation tables in the posts above – 100% of $ARKK’s positions overlap w/the other ETFs.
28/If you’ve ever worked in the Hedge Fund world or even in prop trading then you’re familiar with the “center book” structure of a l/s HF or a pod w/in a bigger fund. The basic idea is that analysts on a single team or PMs in a big fund run separate “sleeves” of capital…
29/In this model the CIO or a sector head or some senior PM sits in the middle and runs a center book – pulling the “best ideas” from all the sleeves to amplify exposure to the highest conviction positions. In this instance, $ARKK basically acts as ARK’s center book…
30/The problem, however, is that ARK’s sleeves themselves have overlap w/EACH OTHER. This is not something you typically see in these types of models. Why? Because correlation! Risk managers throw up when they see a bunch of sleeves like this that are all correlated...
31/…which brings us to the question: why does ARK do it this way? The laser eyes answer wld be bc Ms. Wood is a genius/visionary/one of the greatest investors of all time. The skeptical answer is somewhat more complicated and obv less, um, positive…
32/That is, u cld go down the path of questioning risk management in these funds, as well as the potential marketing/PR/asset gathering implications of running 6 different ETFs, all of which are highly correlated and share many of the same positions…
33/I won’t get into the risk management aspect here, but let’s take the new $ARKX as an example of the latter point about marketing/PR and asset gathering. ARKX launched in late March w/38 positions and $4m of capital. In under 3 weeks, it took in close to $700million of inflows.
34/From launch, the top position in the $ARKX was $TRMB at ~9% of assets. $TMRB was also the #2 position in $ARKQ when ARKX launched. ARKQ owned 2.4m shares of TRMB on 3/29, and as of today, that position has stayed roughly constant…
35/But as fresh money poured into $ARKX, the new ETF bought an additional ~760k shares of TRMB in a very short period of time as net assets of the ETF ballooned from essentially nothing at launch to ~$700m in a matter of weeks…
36/So the #1 position in the new “Space Exploration” ETF is the same as the #2 position in the old “Autonomous Tech & Robotics” ETF. And w/all the hype around the launch of ARKX, funds flow into the new ETF and it buys up the old ETF’s #2 holding…
37/Ok, so optically that’s not great…but then it gets weirder. On 4/1, immediately after the launch of the new Space ETF, ARK magically inserts $TRMB as a new position into its flagship ETF - $ARKK. If anything, the timing has to make you scratch your head a little, right?
38/TRMB has been sitting atop of the ARKQ book now for multiple YEARS, but $ARKK oddly didn’t own a single share in all my data back thru 2019…then all of the sudden, right after launching a new ETF w/TRMB as its #1 pos, ARK decides NOW they need to own TRMB in the flagship ETF?
39/The result was $ARKK wound up buy ~1.5m shares of TRMB (60% of ARKQ’s position size and 2x the size in ARKX) in the span of 4 trading sessions just to make it a bottom of book 49bps position in the flagship fund!
40/Turns out $TRMB isn’t the most liquid stock in the world (trades ~$85m ADV), & now ARK owns over 3 days volume across 3 different active ETFs. Magically, TRMB went up 12% in the 4 days between when ARK first published the ARKX portfolio and ARKK started buying it...
41/[Aside: For more on this topic of what happens when $ARKK enters a new position into the bottom of the book, pls see this exchange from last week re: $SKLZ here:
]
https://twitter.com/ttp_cap/status/1385320430681174016?s=21
]
43/Coincidence? Hmm. Weird? Yes. Shady? $TRMB is +26% YTD & ARKQ is the best performing of the ARK active ETFs. Did ARKQ benefit from the launch of a new ETF that took in ~$700m of fresh $$ & replicated 52% of ARKQ’s exposure, or ARKK taking a brand new stake in ARKQ's #2 pos??
44/The $ARKX rabbit hole is a deep one that we cld spend a lot of time going down. ARK took a lot of grief for owning stuff like Netflix and Deere in a “Space Exploration” ETF. Even @jimcramer called them out on it when it launched:
cnbc.com/2021/03/30/cra…
cnbc.com/2021/03/30/cra…
45/And I wrote an entire (shorter) thread on the #2 position – ARK’s own 3D Printing ETF $PRNT here:
But tbh what is the weirdest thing to me of all about $ARKX was one of the stocks at the bottom of the book: $XLNX (which it recently exited)…
https://twitter.com/ttp_cap/status/1384869413715853312?s=21
But tbh what is the weirdest thing to me of all about $ARKX was one of the stocks at the bottom of the book: $XLNX (which it recently exited)…
46/ARKX launched w/a ~1% in $XLNX. Why is this weird? Bc AMD is buying out XLNX. Both boards agreed to the deal, which is set to close later this year at a fixed exchange ratio! So regardless of what u think about XLNX’s biz, it no longer trades on its own fundamentals anymore!
47/ $XLNX now trades purely as a function of $AMD’s share price and the merger arb spread. There is literally zero reason for any fundamental active manager to BUY this stock as a new position!! You’re not buying $XLNX, you’re buying $AMD.
48/I know there are a lot of excuses why $ARKX needs to exist and/or why it needs to own a bunch of stocks that most people don’t associate w/Space Exploration…but the fact that it launched w/a ~1% position in XLNX alone shld make u question the motivation for this new ETF...
49/…which brings us back to the question in post #31 of this thread: why is ARK structured this way? The cynical answer wld be that it’s all just marketing gimmickry designed to gather max net assets on which to collect 3x higher fees than passive ETFs…
50/Said another way, running $ARKK + all the other “sleeve” ETFs w/exceptionally high overlap and correlation is just a sneaky way of re-packaging the same basic product to retail investors under different fancy thematic names in order to juice AUM/fee income for ARK…
51/Additionally, now that the asset base is sufficiently massive, it becomes a great way to promote (some might say “pump”) the ETF family by strategically timing the purchase of a stock in one fund which benefits one or more of the other ETFs in the same family.
52/This mechanism of built-in reflexivity can work to drive performance in one ETF, which then drives more inflows, which then drives further buying of positions that overlap across the other ETFs, in turn driving more positive performance across the whole family of ETFs...
53/I’m not saying this is the correct conclusion (I’m not not saying that either), and I stopped short of using the word “deceptive” instead of sneaky…but when you examine the evidence, I wldn’t blame anyone for taking this view.
54/And all of that brings me back to another point I made in a prior super long thread: the game for ARK at $50bn AUM is simply different from the game that ARK was playing at $1bn or $5bn of AUM only a short while ago.
55/The game now becomes one of shifting chess pieces around the board to keep the virtuous cycle of fund flows going. Otherwise the reflexivity of this trade works in reverse (as we saw in late Feb), and those chess pieces turn into deck chairs on the Titanic…
END ANOTHER SUPER LONG THREAD
• • •
Missing some Tweet in this thread? You can try to
force a refresh