Thu vaccine update (take 2 - apologies)

597k total doses today, up 12%, so the 7D total is now up to 3.7m.

First doses of 134k are up 14%, so we are now giving first jabs to nearly 850k each week.

1/5 ImageImage
2nd doses of 463k are up a healthy 11%, and bring the total to over 14m. That's broadly equivalent to the most vulnerable groups 1 to 4, though as we've seen throughout the distribution isn't quite that simple.

2.85m over 7 days is another new record.

2/5 Image
England take-up figures show first doses making slow progress, (though this predates the opening of 42-44).

It's disappointing that the 50-54 group has not reached 90%, so we can see a clear trend downwards from 65 to 50. It's too early to form a view on 45-49 yet though.

3/5 Image
2nd dose take-up is now very good above age 75 with good progress in the cohort below too.

Though above 75 there are still around 10% of those who had 1st jabs who have not yet had a second one, slightly worrying for the most vulnerable in society.

4/5 Image
For completeness, here's the equivalent PHE figures published simultaneously. The percentages here are based on NIMS figures, which look like they may be slightly more realistic than the ONS figures used by the NHS data.

5/5 ImageImage

• • •

Missing some Tweet in this thread? You can try to force a refresh
 

Keep Current with John Roberts

John Roberts Profile picture

Stay in touch and get notified when new unrolls are available from this author!

Read all threads

This Thread may be Removed Anytime!

PDF

Twitter may remove this content at anytime! Save it as PDF for later use!

Try unrolling a thread yourself!

how to unroll video
  1. Follow @ThreadReaderApp to mention us!

  2. From a Twitter thread mention us with a keyword "unroll"
@threadreaderapp unroll

Practice here first or read more on our help page!

More from @john_actuary

1 May
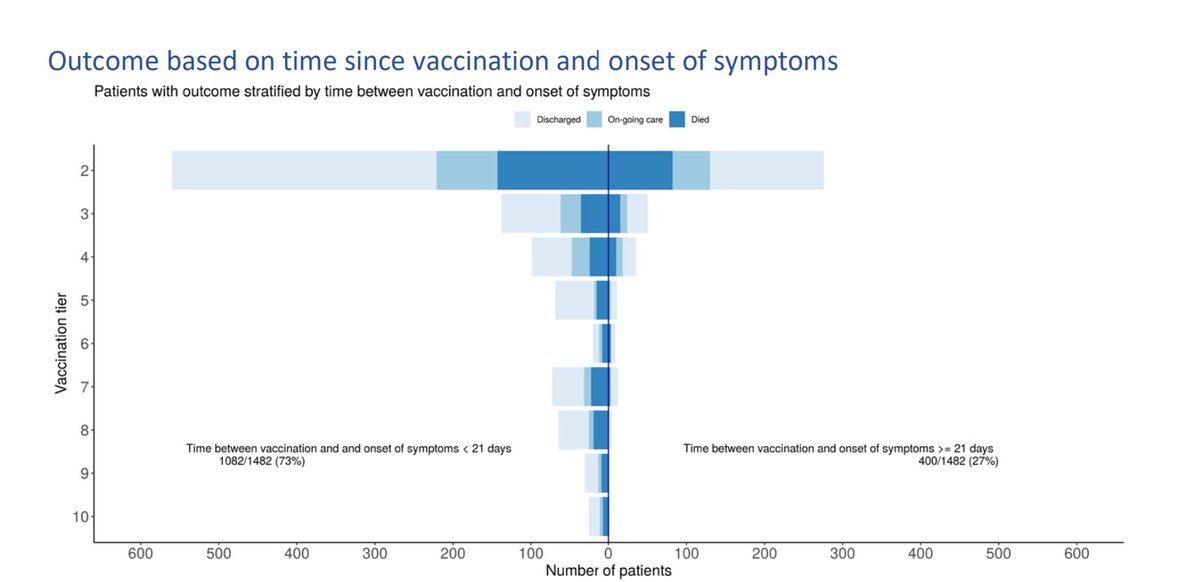
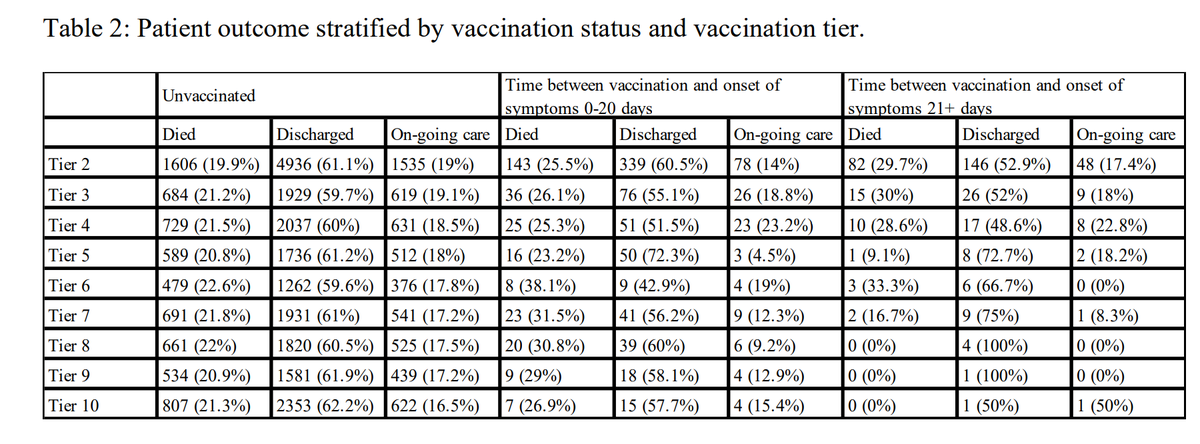
A paper for SAGE released yesterday analyses hospital admissions post vaccination. Reinforcing the point that one dose does not give full protection, 400 people entered hospital and subsequently died who displayed symptoms after vaccination.
1/6 assets.publishing.service.gov.uk/government/upl… Image
The majority of these (72%) showed symptoms within 21 days of the jab, so probably were infected prior to the jab, or before immunity develops. However, 113 people only showed symptoms after 21 days or more (likely "vaccine failure").

2/6 Image
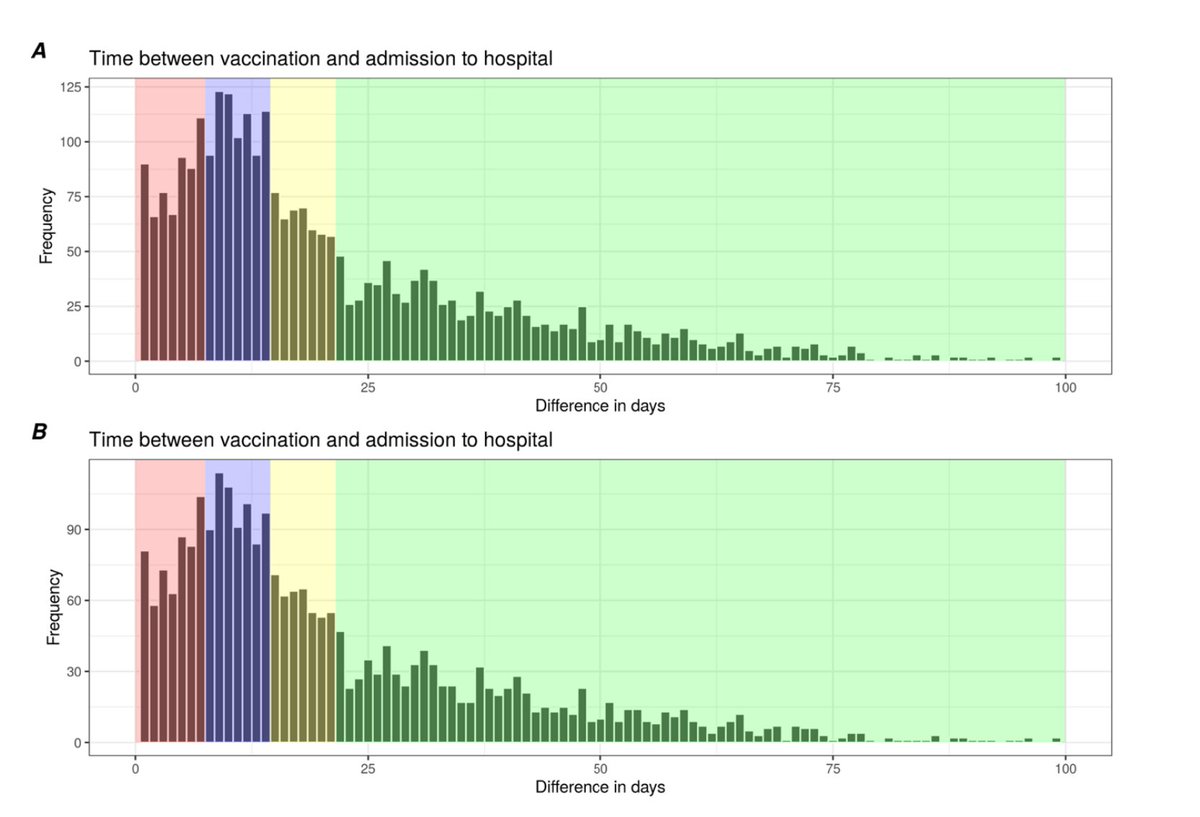
You can see also that the "over 21 day" cases weren't confined to the few days after, but are spread over a longer period. (Note these graphs relate to admissions, but the point is the same.)

The decline in the green zone will be at least partly due to declining prevalence.

3/6 Image
Read 6 tweets
30 Apr
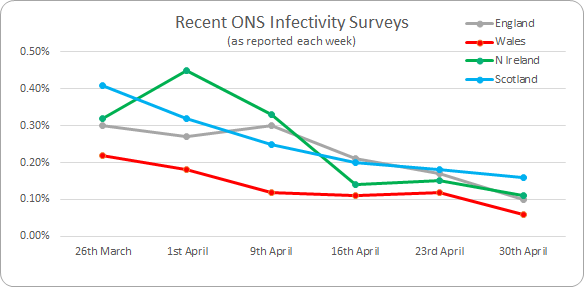
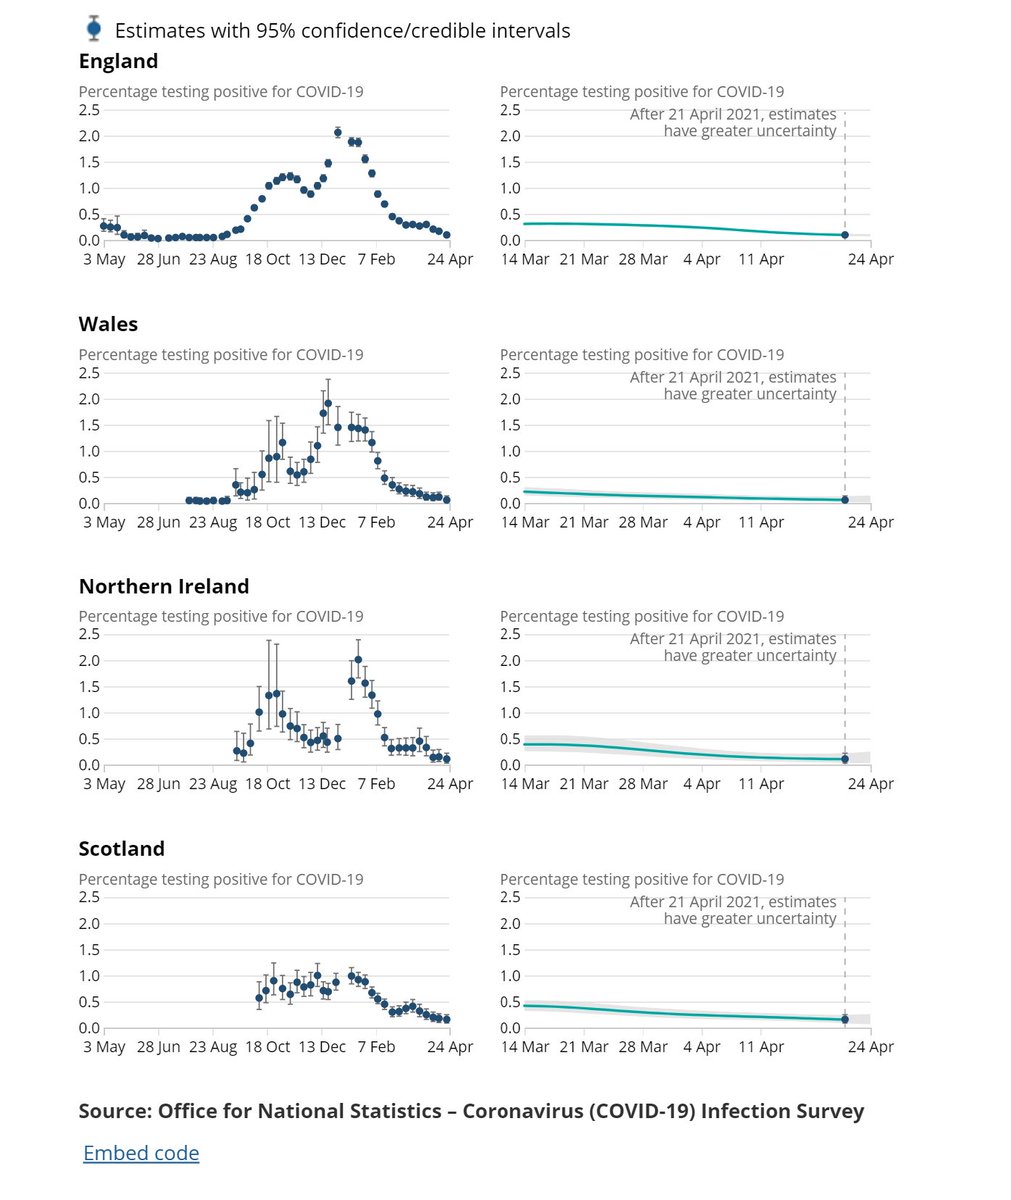
The latest ONS infection survey shows dramatic falls across the UK, with England falling by over 40% and Wales by 50% in just one week. (Data is to 24th April.)

E falls from 0.17% to 0.10% or 1 in 1,010.
W falls from 0.12% to 0.06% or 1 in 1,570

1/6 Image
There are slightly less dramatic falls in Scotland and Northern Ireland, though still very encouraging.

NI falls from 0.15% to 0.11% or 1 in 940
S falls from 0.18% to 0.16% or 1 in 640.

2/6 Image
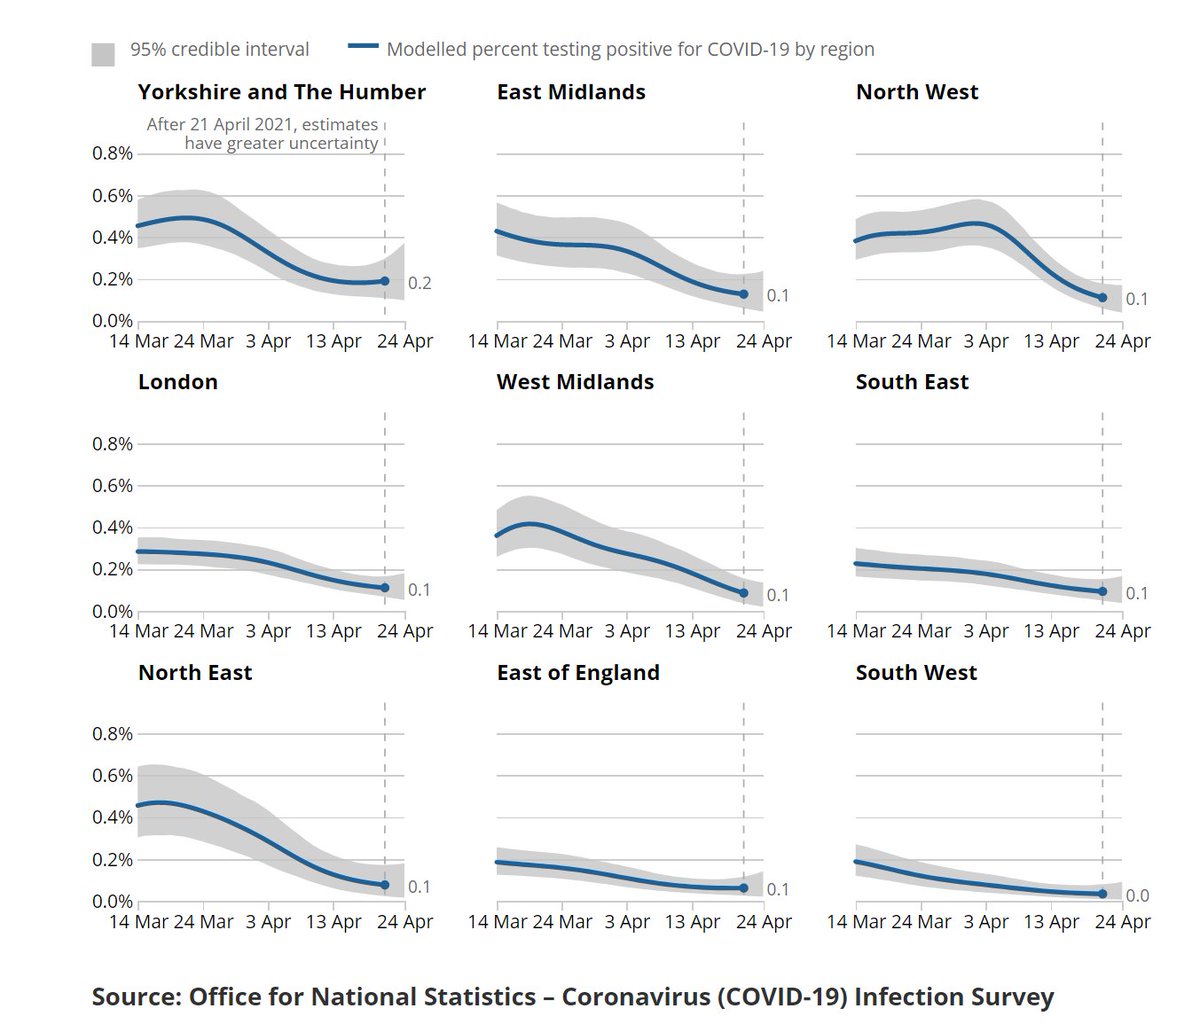
Regionally, only Yorkshire and Humber now rounds to 0.2% (actually 0.19%).

In the opposite corner the SW is now shown as 0.0%, though is actually 0.03% or 1 in 2,980.

3/6 Image
Read 6 tweets
30 Apr
The latest @ONS survey on vaccine sentiment shows continuing strong support to have (or have had) the vaccine. There's still the downward shape by age, but even below 30 it's put at 88%.

We have started to see a downward trend in reality too, as we work through the ages.

1/5 Image
As noted yesterday, for England the 50-54 group is not quite yet at 90%, which suggests the actual picture is slightly lower than the survey (which puts 50-69 at 96%). Whether this is due to hesitancy or practical issues with attending is not obvious.

2/5 Image
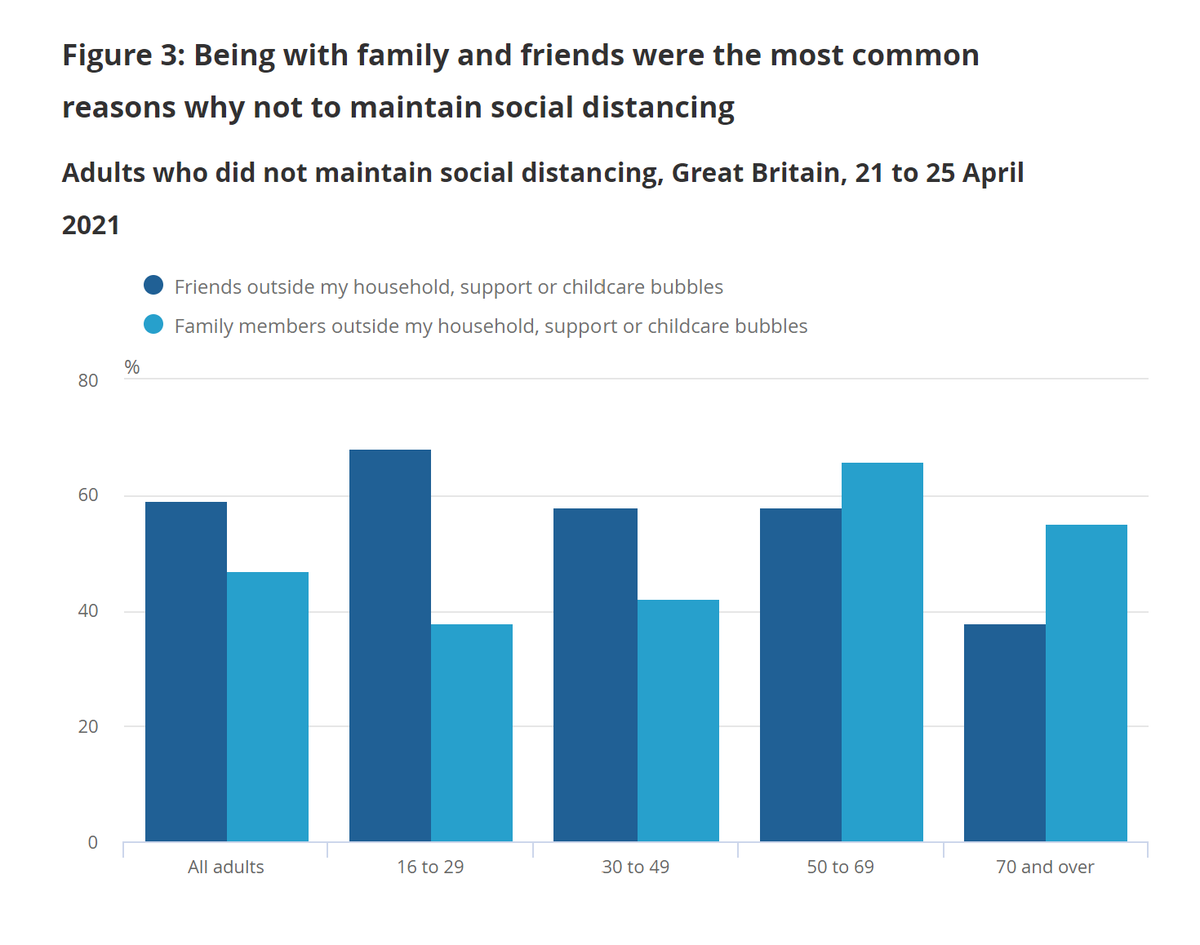
Other data in the survey shows higher proportions of younger people not maintaining social distancing with friends, whereas for older ages it's mixing with family members that is more the reason for not following the guidance.

3/5 Image
Read 5 tweets
28 Apr
The PHE study reported widely today shows that those who are vaccinated who still get infected are 40% to 50% less likely to pass it on to a household contact than those unvaccinated.

1/7
khub.net/documents/1359…
This is an important finding, as household setting transmission is more difficult to suppress through the interventions we are all familiar with, particularly in large multi-generational households.

2/7
This benefit is on top of the lower risk in becoming infected, which is typically around 65% after a first dose (there isn't enough data on any further protection from a 2nd dose).

So the overall first dose effect in terms of protecting your family becomes around 85%.
3/7
Read 7 tweets
28 Apr
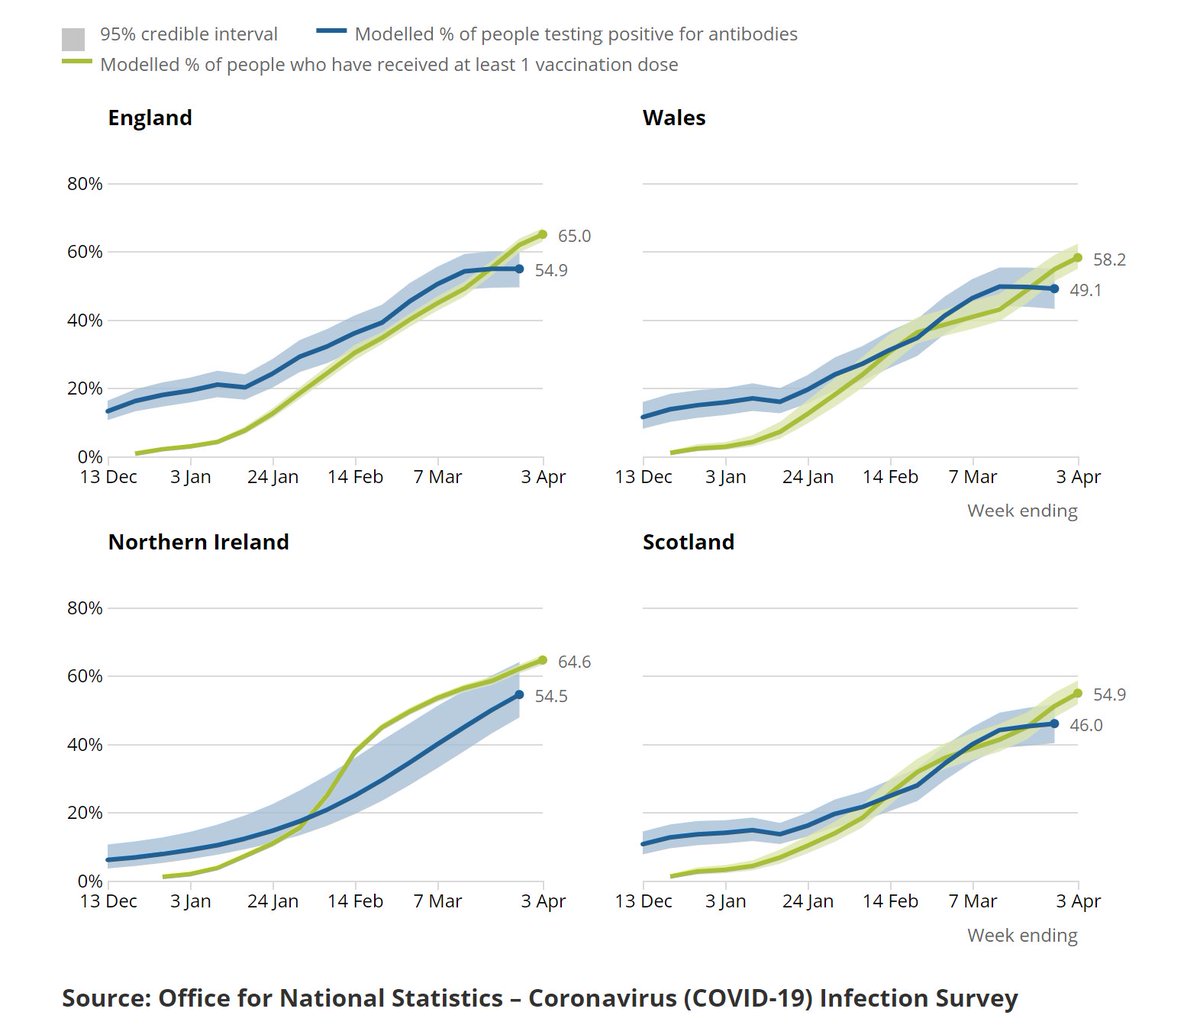
The latest ONS antibody survey is out. The last one (2 weeks ago) showed a surprising pause in the increase in the proportion with antibodies, but this has now resumed.

By country the movement is
E: Up from 55% to 68%
W: 49% to 61%
NI: 55% to 63%
S: 46% to 58%

1/5
Looking at England, by age we can see the 2nd dose effect kicking in at older ages, which had started to fall away. eg Over 80s is back up from 78% to 87%.

We also have modelled estimates for those vaccinated - these appear slightly higher than other data, eg NHS.
2/5
By region London is put at around 10% behind the rest in terms of having had the first dose, but is "in the pack" in terms of antibody prevalence - maybe due to higher levels of antibodies acquired through infection.

3/5
Read 5 tweets
14 Apr
The latest antibody survey from @ONS has been published, and show that levels have flattened off in England and are falling in the oldest age groups. Similar patterns are seen in W and S, though not in NI.

The overall % in England is 54.9%, compared with 54.7% two weeks ago.
1/5
In England the first sign of a fall in older ages was seen two weeks ago, but is now clearer and extends down to all groups over 65. Younger age groups are continuing to rise.

The fall over the 2 weeks for 80+ is from 86% to 78%, and is 8-9% in the three upper groups.

2/5
Visually you can see it here at the latest point in time, or follow the link to have the interactive version. ons.gov.uk/peoplepopulati…
3/5
Read 5 tweets

Did Thread Reader help you today?

Support us! We are indie developers!


This site is made by just two indie developers on a laptop doing marketing, support and development! Read more about the story.

Become a Premium Member ($3/month or $30/year) and get exclusive features!

Become Premium

Too expensive? Make a small donation by buying us coffee ($5) or help with server cost ($10)

Donate via Paypal Become our Patreon

Thank you for your support!

Follow Us on Twitter!