Quite frankly, I don't (and couldn't know). I've mucked around from simple to ensemble #ML models over the last year, only to realize that something this complex cannot be modelled or predicted.
However, you can pick up what's happening, currently, based...
+
... off the standard epidemiological metrics - changes in trends, TPR, testing rates, recoveries etc. And what that means in terms of the near and medium-term horizons.
The most sensible benchmark would be TPR declining or levelling off against testing rates that are rising...
+
... against/ahead of case growth rates. If the data is passably reliable, it's a good indicator that a peak is to be expected, followed by a decline.
This would also show in R[t] hitting 1.0 on a decline and continuing to go under. If testing is doubtful, TPR is rising ...
+
... cumulative CFR is declining (temporarily) from an asymptotic trend, you don't know what's going on and certainly should not expect a real peak in infection in the region of interest.
Wish I could be more optimistic about this, but I don't see a quick turnaround ...
+
... regardless of what the daily case numbers suggest.
• • •
Missing some Tweet in this thread? You can try to
force a refresh
There are certain matters on which - for the survival (or a better future) of the collective - everyone (aka those whose survival is not threatened) contributes to or invests in. Education, Public Health, National Security are three well understood cases.
... argue stupidly for "free markets" in these contexts haven't , quite clearly, thought through any of this and so end up betraying their immature understanding of how markets and societies generally function.
It can also be considered a form of insurance by/for those...+
...that have the most to lose (wealth, status, authority etc). There aren't too many of them - if you get the drift. So when things get bad, if it were everyone for himself, there's nothing preventing the larger # of threatened members of the society from banding together...+
... and shifts his prediction and says something else. And when that fails as well, then he adds some other variable which has behaved unpredictably. You get the drift, if you're an Indian.
The problem though, is NOT that they're not epidemiologists. The issue is that ... +
... they're #clueless hacks who know one thing (in a bounded domain) possibly well. But cannot distinguish an extremely complex phenomenon, with fractal behavior/cascaded (or multi-scale) consequences and feedback loops, which is modelling-resistant.
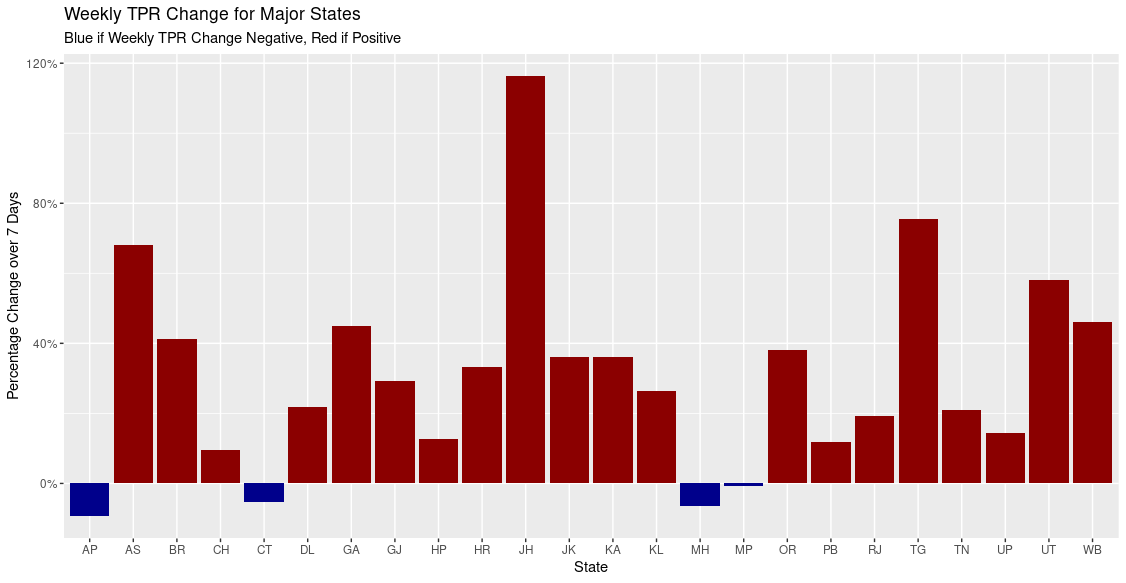
Average TPR for the states rises to 16%+, ranging from 3% to 33%
MH, AP, CT and MP register negative TPR growth over the last week. Average TPR growth is 30% ranging from 13% to 116% for the states where it's rising.
+
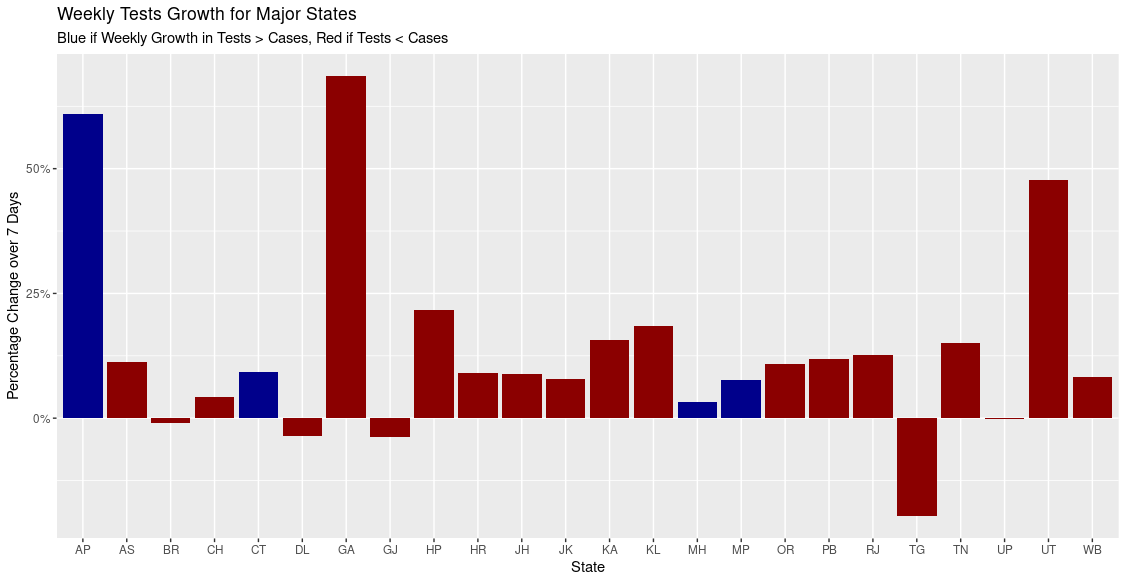
MH, CT, DL and MP register a case doubling rate greater than 50 days viz. containment. This has to be seen against growth in testing accompanied by a decline in TPR.
Average weekly case growth for the other states ~ 40%, ranging between 28% to 98%.
+
This is another important read from @nature that highlights the problems with and limitations of R[t] and makes a case against over-reliance on it, especially for public policy wrt *easing* restrictions and return to 'normalcy'.
+ nature.com/articles/d4158…
The important takeaway is to understand the asymmetry in decision-making against the uncertainty implicit in this metric (aka what we cannot know).
If R[t] is rising above 0.9, should we enact restrictions? - is a VERY DIFFERENT Q, from the PoV of risk - than ... +
- Should we ease up restrictions because R[t] has declined from 1.3 to 0.8 (say) and seems to be going lower?
The first Q is a definite YES, with no doubts whatsoever. The second, however, is wide open, because things can reverse and get worse. So, you look at other ... +
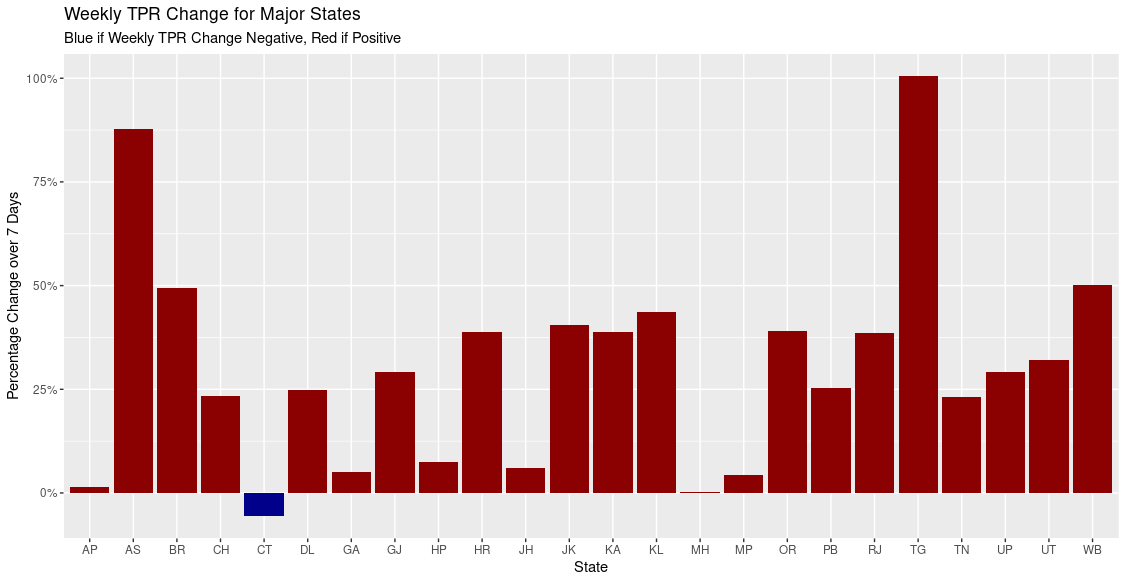
Latest TPR for most states has increased. The inference is that the spread continues unchecked and/or testing has been reduced. Average TPR rises to 16%.
MH, while lowest, registers a mild rise in TPR over the last week. CT is the sole negative.
+