
$BTC $BTCUSD #BTC
🅼🅴🅶🅰 Thread on several Models / indicators / On Chain Analysis
Part 4
Update at $btc=57k, May 2020
🅼🅴🅶🅰 Thread on several Models / indicators / On Chain Analysis
Part 4
Update at $btc=57k, May 2020
https://twitter.com/Yodaskk/status/1337060555966844932
Taking support on NVT like previous cycles 

RVT ratio
previous resistance as support, acting similarly as previous bull cycles
previous resistance as support, acting similarly as previous bull cycles

Bitcoin Mayer Multiple
still In Bull market territory
still In Bull market territory

200 week moving average heatmap now in yellow
advanced in the cycle -similar to q2/q3 2017-but probably not a top yet
advanced in the cycle -similar to q2/q3 2017-but probably not a top yet

Puell multiple
After the higher low, now in a consolidation between 2 & 3 like previous cycles -similar to q2/q3 2017-
After the higher low, now in a consolidation between 2 & 3 like previous cycles -similar to q2/q3 2017-

S2F
no need for explanation
no need for explanation

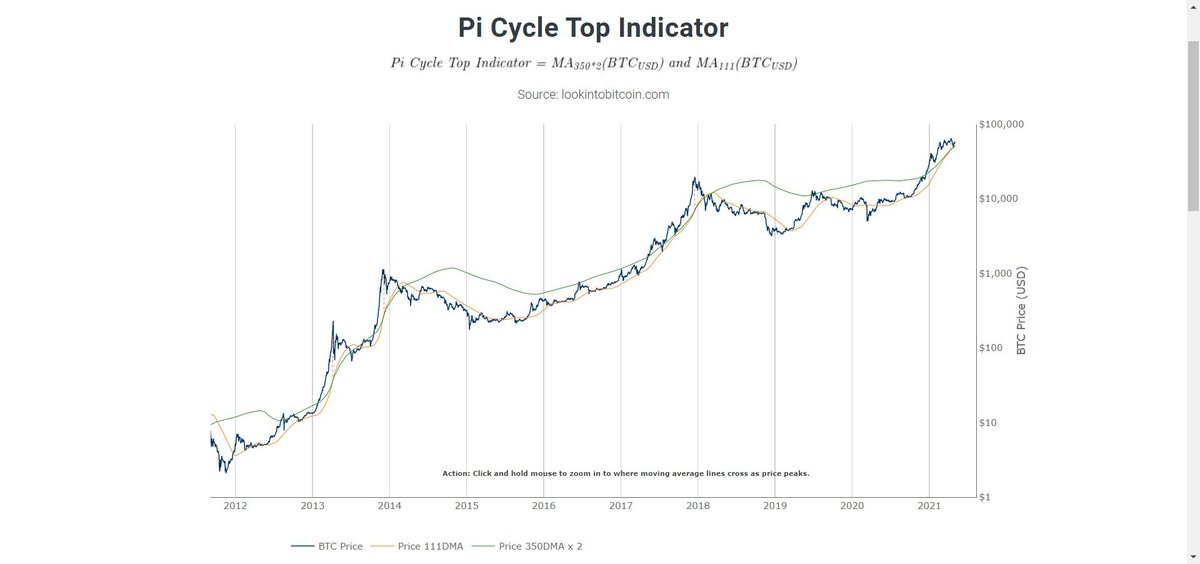
Pi cycle top indicator gave a pretty good signal at 60k+
This one would be the most bearish signal as of yet
This one would be the most bearish signal as of yet
Bitcoin log growth curves
Similar as previously, seems advanced in the cycle, but doesnt look as a top -probably like q2/q3 2017-
Similar as previously, seems advanced in the cycle, but doesnt look as a top -probably like q2/q3 2017-

MVRV Z-Score made a Parabolic advance starting like previous bull markets
now doing a consolidation between 2 & 6 similar to q2/q3 2017
now doing a consolidation between 2 & 6 similar to q2/q3 2017

1Y+ HODL wave
signs of distributions like previous bull markets ?
signs of distributions like previous bull markets ?

RHOL ratio
consolidation around 10k like previous cycles
consolidation around 10k like previous cycles

Relative Unrealized profit/loss
consolidating in the greed zone -like q2/q3 2017- but didnt touched yet the euphoria area
consolidating in the greed zone -like q2/q3 2017- but didnt touched yet the euphoria area

Miner capitulation, similar to previous cycle
Lol it actually looks so similar, with the halving kicking the hyperspeed
Lol it actually looks so similar, with the halving kicking the hyperspeed

Bitcoin long term power law
on the last part of the bull cycle and approaching resistance soon
on the last part of the bull cycle and approaching resistance soon


BEAM indicator
mid cycle, similar to q2/q3 2017
mid cycle, similar to q2/q3 2017

mayer multiple bands
consolidating between bullish and bullish extension
consolidating between bullish and bullish extension

Based from their lows, this cycle seems on track compared to 2 previous ones - and also ~~like q2/q3 2017

$btc reserve on exchange continueing to be depleted rapidly and at the same speed

NVM hitting highs never seen before

MPI indicating that miners are really quiet since March 1st

Conclusion:
Some over heating signs start to appear, but overall it seems we are at the equivalent of q2/q3 2017, and that there is still 3-6 months of bull market and at least a last leg up imo
SOURCES:
stats.buybitcoinworldwide.com
charts.woobull.com
lookintobitcoin.com/charts/
Some over heating signs start to appear, but overall it seems we are at the equivalent of q2/q3 2017, and that there is still 3-6 months of bull market and at least a last leg up imo
SOURCES:
stats.buybitcoinworldwide.com
charts.woobull.com
lookintobitcoin.com/charts/
Previous thread
Part 1
$btc= 5k, March 17th 2020, post corona drop
Part 1
$btc= 5k, March 17th 2020, post corona drop
https://twitter.com/Yodaskk/status/1239928982784610305?s=20
Previous Thread
Part 2
Update at $btc=9300, July 2020
Part 2
Update at $btc=9300, July 2020
https://twitter.com/Yodaskk/status/1285562878146338816?s=20
Previous thread
Part 3
Update at $btc=18k, Dec 2020
Part 3
Update at $btc=18k, Dec 2020
https://twitter.com/Yodaskk/status/1337060555966844932?s=20
• • •
Missing some Tweet in this thread? You can try to
force a refresh


