News out of Prince Rupert continues to be good.
Two months ago, it was the hotspot for transmission in British Columbia.
85% of adults were given a vaccine shot.
Weekly #COVID19 cases fell from more than 100 to 3.
Then they went to 2.
Last week, there was ONE CASE.
Two months ago, it was the hotspot for transmission in British Columbia.
85% of adults were given a vaccine shot.
Weekly #COVID19 cases fell from more than 100 to 3.
Then they went to 2.
Last week, there was ONE CASE.

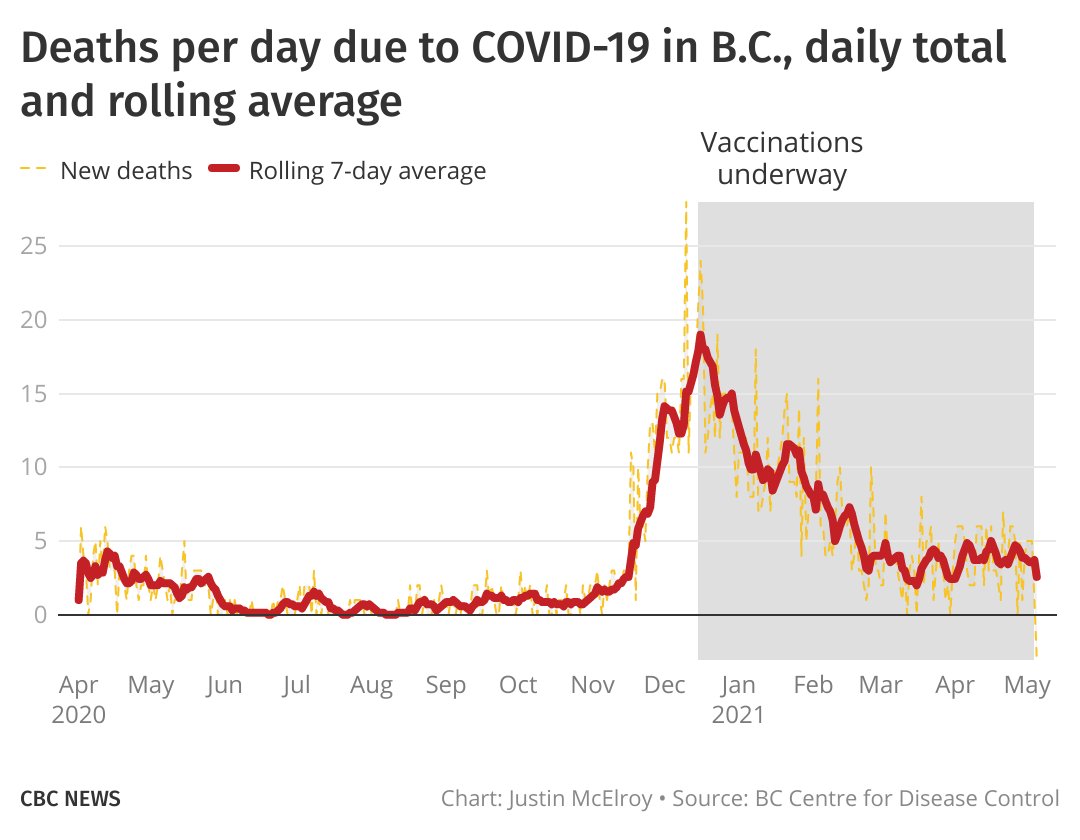
everyone says bring back the boring chart but really let's have the prince rupert chart for the entire province
More good news!
One month ago, the B.C.'s transmission hotspot was Whistler.
Everyone there was given a chance to get a shot.
There were 410 cases in their local health area at the peak.
Last week, there were 39.
A 95% reduction, three weeks after mass vaccination.
One month ago, the B.C.'s transmission hotspot was Whistler.
Everyone there was given a chance to get a shot.
There were 410 cases in their local health area at the peak.
Last week, there were 39.
A 95% reduction, three weeks after mass vaccination.
(i am not making that chart right now because i need to go on an errand now but just imagine one of those charts where the line goes down sharply and smile)
• • •
Missing some Tweet in this thread? You can try to
force a refresh


