A 🧵 on carbon budget uncertainties (for walkers)...

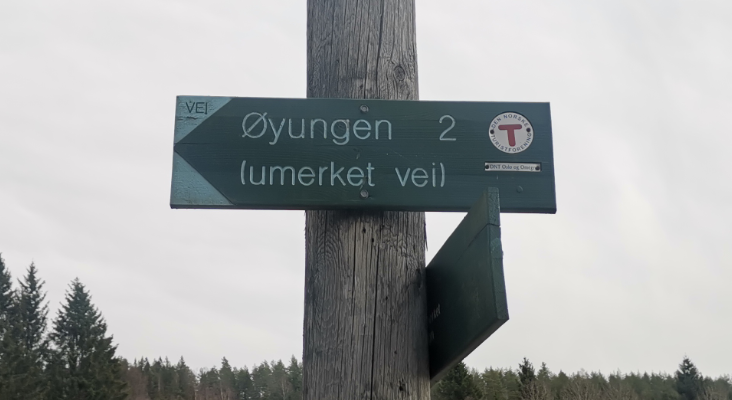
It is 2km to the lake, which means it could be 1.5km or 2.5km given rounding.

If I have walked 1km, then it is 0.5km to 1.5km to go. That is a huge uncertainty!

1/
Carbon budgets are often presented for 66% chance (of avoiding the target), which in this analogy, would say after 1km that if I walk 0.5km further there is a 66% chance I have not reached the lake.

Or after 1.5km, there is a 33% change I have still not reached the lake!

2/
There are a few issues here. There will be a non-zero probability I have reached the lake after only 1km, which means the measurements were wrong.

Carbon budget uncertainties for 1.5°C also include negative carbon budgets, meaning it may already be too late to avoid 1.5°C!

3/
I have taken 1.5km & 2.5km as a 33-66% chance (as an analogy), but more likely it would be 5-95% chance or higher. This was meant to be an analogy, not science.

4/
This is what scientists do while walking in the forest (or maybe it is just what I do).

Not sure it is such a great analogy, but I am sure most walkers (or riders) are familiar with rounding issues in distance measurements...

/end

• • •

Missing some Tweet in this thread? You can try to force a refresh
 

Keep Current with Glen Peters

Glen Peters Profile picture

Stay in touch and get notified when new unrolls are available from this author!

Read all threads

This Thread may be Removed Anytime!

PDF

Twitter may remove this content at anytime! Save it as PDF for later use!

Try unrolling a thread yourself!

how to unroll video
  1. Follow @ThreadReaderApp to mention us!

  2. From a Twitter thread mention us with a keyword "unroll"
@threadreaderapp unroll

Practice here first or read more on our help page!

More from @Peters_Glen

7 May
There is a lot of confusion about net-zero GHG & CO₂ emissions, they are different.

The EU & US have a target of net-zero GHG emissions in 2050, which is ~20 years ahead of the global average (coincidentally, global net-zero CO₂ emissions is ~2050).

1/
For developing countries to have a later net-zero GHG year, say 2090 (~20 years after the global average), it requires that developed countries are net negative to compensate developing countries & maintain net-zero GHG globally. (a point often made by @Oliver_Geden).

2/
I think we all agree & accept developing countries will find their own path to net-zero, & one that is later than developed countries.

But, I also think many confuse the net-zero years for CO₂ & GHG emissions.

Many obsess on 2050, when there is actually a broad range!

3/
Read 4 tweets
6 May
Keeping below 1.5°C requires rapid emission reductions at the global level.

What do scenarios imply for key regions?

In this thread, I show the fossil CO₂ emissions in key regions. These scenarios do not include equity considerations, these are cost-efficient pathways.

1/ Image
2. In the OECD, fossil CO₂ emissions are are already in a decline.

On average, from 2020, a 44% reduction by 2030 & 95% by 2050. This requires accelerating climate action beyond current levels. Image
3. Asia is a big challenge. Emissions are growing strongly now, but has to drop by 47% from 2020 to 2030 & by 88% to 2050.

This requires a dramatic reversal of current trends. In many respects, this makes the challenge harder in Asia (developing) compared to OECD (developed). Image
Read 9 tweets
5 May
EU27+UK GHG emissions (including LULUCF) have declined 30% from 1990 to 2019.

By changes by sector were:
* Energy: -28%
* Industry: -30%
* Agriculture: -20%
* Waste: -44%
* LULUCF: +37% (stronger sink)

1/
The energy sector is the largest in terms of GHG emissions.

The changes from 1990 to 2019 were:
* Energy industries: -41%
* Manufacturing: -41%
* Transport: +20%
* Other (buildings, etc): -27%
* Fugitive: solid -73%, oil/gas -46%

Transport is a problem...

2/
Considering only CO₂ emissions, emissions are nearly totally dominated by energy (see previous tweet for details), with some emissions from industrial processes (cement, etc) and LULUCF as a sink.

3/
Read 9 tweets
4 May
Mitigation will cause the ocean sink to have reduced efficiency because of:
* reductions in carbonate buffer capacity in scenarios with intermediate or no mitigation
* reduced transport of anthropogenic carbon from surface to depth in 1.5°C scenarios.

1/
bg.copernicus.org/articles/18/27…
2. Atmospheric CO₂ has grown exponentially over the industrial era. Under an exponential forcing regime, ocean anthropogenic carbon uptake also grows exponentially.
3. Since these conditions have held over the historical era, the ocean sink has historically maintained a high efficiency.

In future scenarios, regardless of the degree to which emissions are mitigated by 2080, efficiency of ocean anthropogenic carbon uptake will decline.
Read 4 tweets
3 May
Mitigation scenarios based on the Shared Socioeconomic Pathways (SSPs) are designed to have a certain radiative forcing in 2100. Pathways to 2100 differ.

Since they are based around MAGICC, they all converge to the RCP level in 2100 (other models may give different forcing).

1/ Image
The radiative forcing is dominated by CO₂. The large spread in CO₂ means there is a range in "remaining carbon budgets".

The two bold lines are the 'marker' scenarios used in Earth System Models, all thin lines are similar scenarios from different energy-system models.

2/ Image
The differences between total & CO₂ forcing is non-CO₂. From the peak around 2030-2040, non-CO₂ forcing causes a declining temperature trend (from non-CO₂ components).

The two marker scenarios are low, meaning larger carbon budgets.

3/ Image
Read 5 tweets
1 May
Cumulative CO₂ emissions explain most future global warming, assuming sufficient action on non-CO₂.

Distributing a remaining carbon budget of 500GtCO₂ with a linear decline (black) leads to net-zero ~2045.

Depending on short-term action, many net-zero years are possible.

1/
If emissions decline exponentially, also in the 'Raupach curve', net-zero emissions never occur & the remaining carbon budget is never exceeded. Net-zero is not a necessity, but a modelling outcome.

The 'Raupach curve' is explained here: iopscience.iop.org/article/10.108…

2/
Most scenarios are based on cost-optimisation to a 2100 target, which means the temperature can peak & decline, overshooting the 2100 target before returning to it by 2100.

These scenarios are where the net-zero ~2050 come from (2059 in this figure).

3/
Read 5 tweets

Did Thread Reader help you today?

Support us! We are indie developers!


This site is made by just two indie developers on a laptop doing marketing, support and development! Read more about the story.

Become a Premium Member ($3/month or $30/year) and get exclusive features!

Become Premium

Too expensive? Make a small donation by buying us coffee ($5) or help with server cost ($10)

Donate via Paypal Become our Patreon

Thank you for your support!

Follow Us on Twitter!

:(