1/10 Recently, I became convinced that the #bitcoin price simply went up too fast and this consolidation is functioning as a re-accumulation phase
IMO the January local top was the turnaround point in the market structure 🏔️
I'll elaborate in this 🧵 with some on-chain data ⛓️
IMO the January local top was the turnaround point in the market structure 🏔️
I'll elaborate in this 🧵 with some on-chain data ⛓️
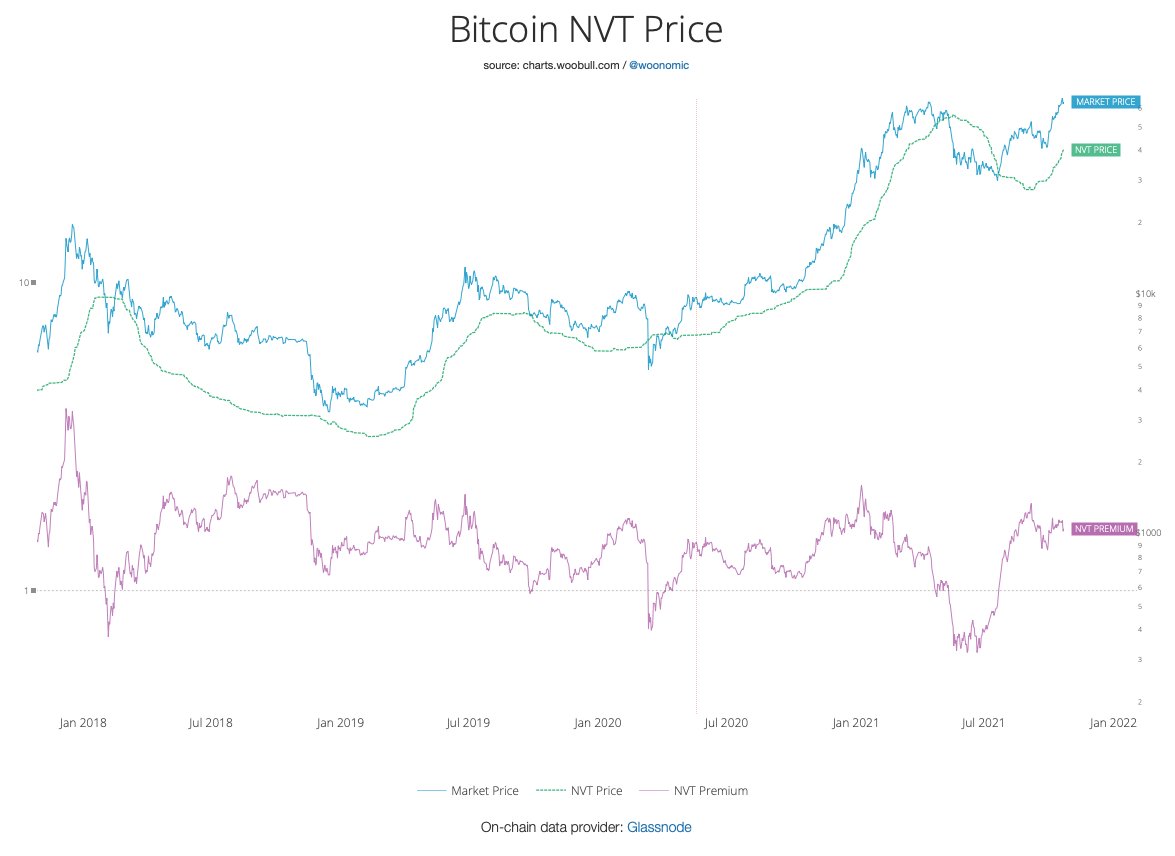
2/10 During the January local top, the #bitcoin price went up FAST 🥵
Compared to 2017, this run-up happened:
1) at an earlier post-halving date
2) at a faster acceleration, and
3) to a higher degree (reached a 🌡️ of 7 - which in 2017 it only reached during the blow-off top)
Compared to 2017, this run-up happened:
1) at an earlier post-halving date
2) at a faster acceleration, and
3) to a higher degree (reached a 🌡️ of 7 - which in 2017 it only reached during the blow-off top)


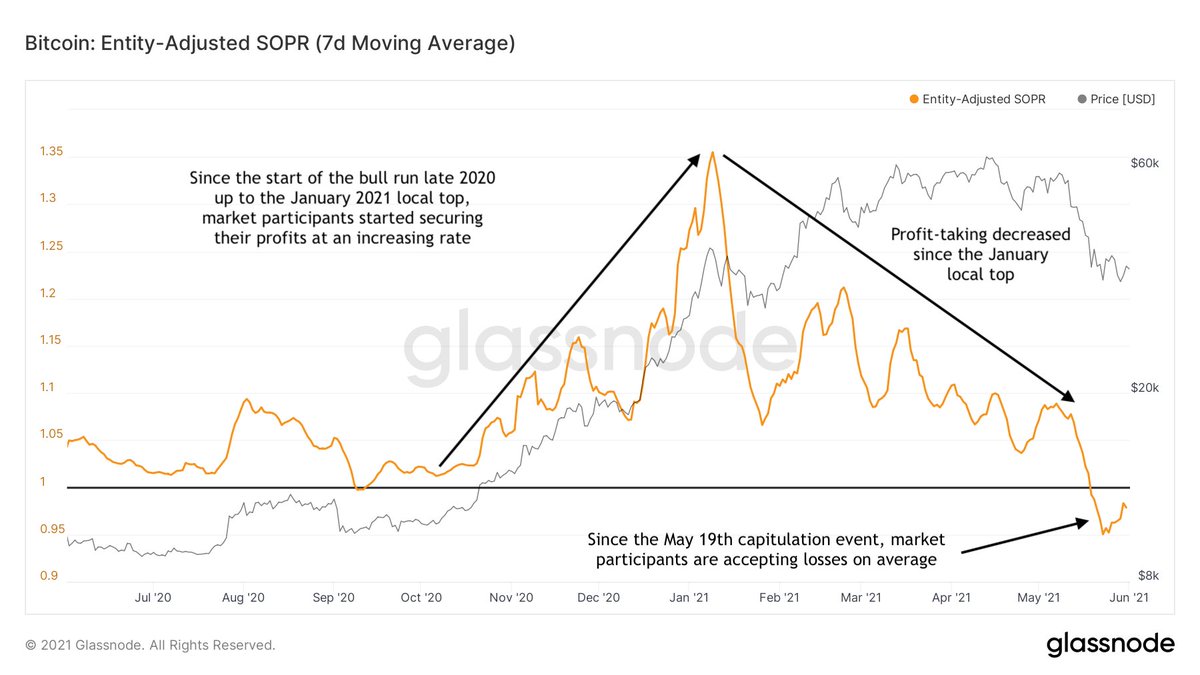
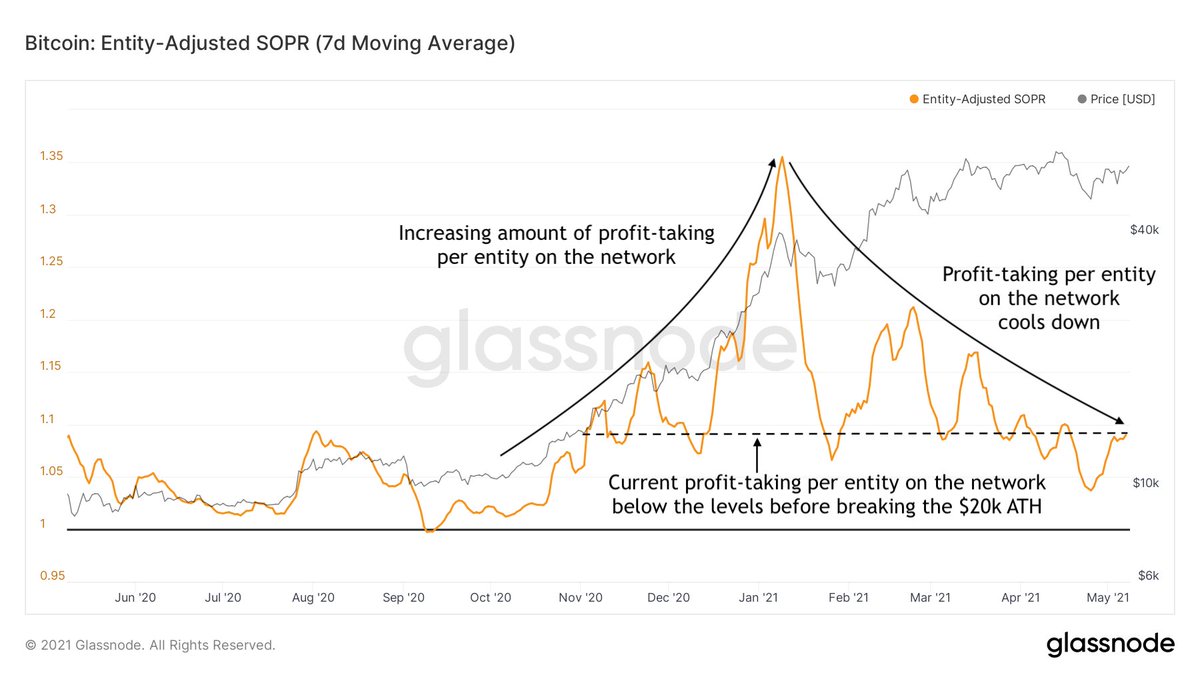
3/10 Due to the rapid price increase, unrealized profits were sky high, triggering an increasing number of entities to take profits
Since the January local top, profit-taking cooled down to pre-ATH levels - despite the #bitcoin price itself still grinding up 👀
Since the January local top, profit-taking cooled down to pre-ATH levels - despite the #bitcoin price itself still grinding up 👀
4/10 So who were selling? 🧐
The most obvious group is the long-term HODL'ers. They became net sellers late Oct at ~$13k, but sell pressure tapered off fast and they now net buyers again
Simply put: HODL'ers with weak hands were shaken out, as strong hands kept accumulating 👊
The most obvious group is the long-term HODL'ers. They became net sellers late Oct at ~$13k, but sell pressure tapered off fast and they now net buyers again
Simply put: HODL'ers with weak hands were shaken out, as strong hands kept accumulating 👊

5/10 A similar pattern can be seen with the miners ⛏️
Compared to the long-term HODL'ers, the miners waited longer to take profits - but did so more drastically 👀
Their profit-taking didn't take long though, as they have been net accumulators again since March 30th 😋
Compared to the long-term HODL'ers, the miners waited longer to take profits - but did so more drastically 👀
Their profit-taking didn't take long though, as they have been net accumulators again since March 30th 😋

6/10 So what is taking price so long? 😴
Aside from the actual profit-taking (which just takes a while), an explanation can be sought in futures funding rates 💸
After the January local top, funding rates actually increased - literally creating an incentive to push the price 📉
Aside from the actual profit-taking (which just takes a while), an explanation can be sought in futures funding rates 💸
After the January local top, funding rates actually increased - literally creating an incentive to push the price 📉

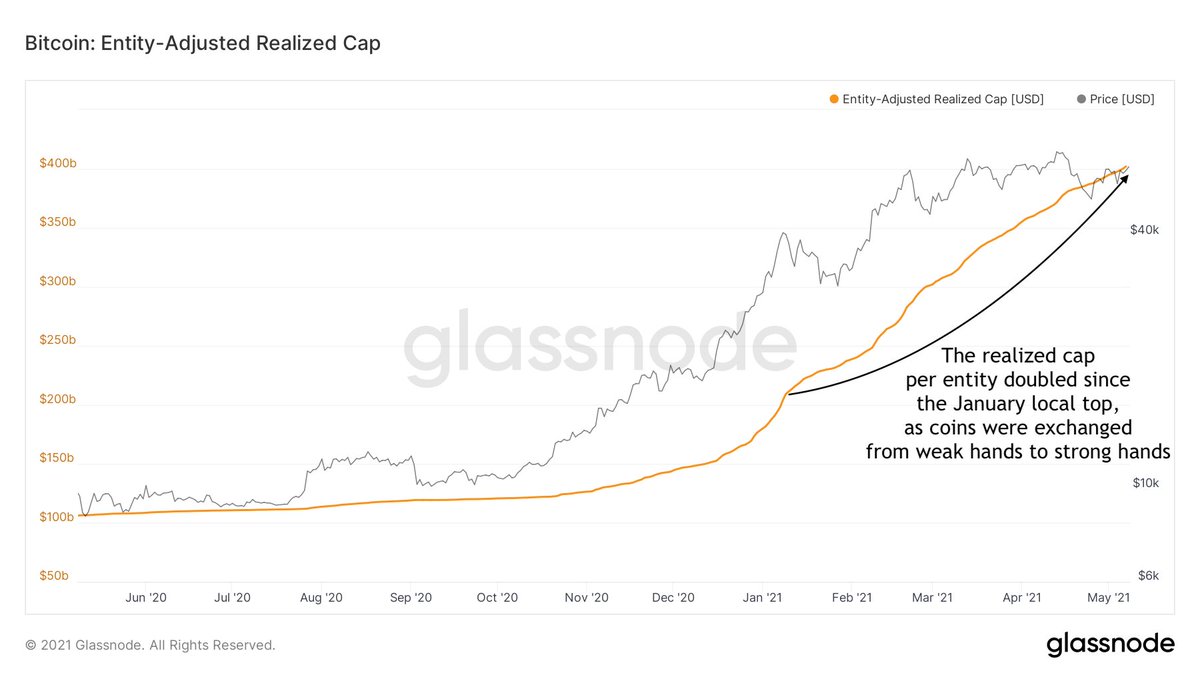
7/10 There are benefits to this re-accumulation though
As coins were exchanged from weak hands to strong hands since January, the realized cap (total value of all #bitcoin when were last moved on-chain) per entity nearly doubled
Current prices are therefore now more 'normal'
As coins were exchanged from weak hands to strong hands since January, the realized cap (total value of all #bitcoin when were last moved on-chain) per entity nearly doubled
Current prices are therefore now more 'normal'
8/10 Another positive consequence of this re-accumulation is that we're building a massive price support base that may act as support if we were to revisit these prices in the future 💪
16.3% of the #Bitcoin has moved at prices above the $1T market cap - validating that as well
16.3% of the #Bitcoin has moved at prices above the $1T market cap - validating that as well

9/11 Besides the mentioned accumulation by long-term HODL'ers and miners, there are signs that large entities (e.g. institutionals) are accumulating
For instance: since February 6th, ~427k BTC have been stacked in addresses holding 100-1,000 #bitcoin
Just yesterday: ~52k BTC 👀
For instance: since February 6th, ~427k BTC have been stacked in addresses holding 100-1,000 #bitcoin
Just yesterday: ~52k BTC 👀

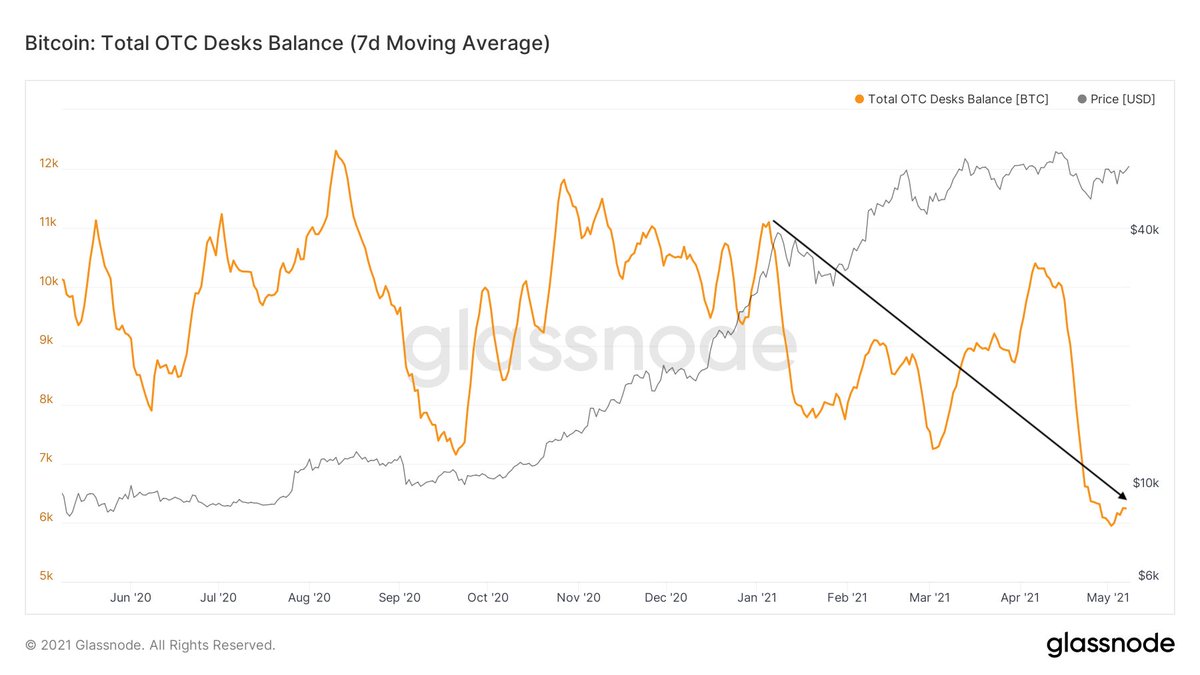
10/11 Finally, another sign of possible institutional accumulation during this relative price consolidation since the January local top is the clear declining trend in the #bitcoin balances of the Over The Counter (OTC) trading desks that are often used by these parties
11/11 So my current view is that:
- In January, price got overheated
- HODL'ers & miners with weak hands took profits
- Besides profit-taking, high funding rates provided a headwind for price growth
- Miners, HODL'ers & possibly institutionals with strong hands kept accumulating
- In January, price got overheated
- HODL'ers & miners with weak hands took profits
- Besides profit-taking, high funding rates provided a headwind for price growth
- Miners, HODL'ers & possibly institutionals with strong hands kept accumulating
• • •
Missing some Tweet in this thread? You can try to
force a refresh