1/6 Thread: What is the market's valuation multiple?
One of the reasons I was becoming bullish on some of the big tech stocks ~2-3 years ago is some of the them, especially $AAPL was trading at market multiple.
2/6 That didn't make quite sense to me since I thought Apple was clearly a better business than the broader "market".
I now think there was a flaw in that argument.
If I remember correctly, I first came to know about this flaw from one of the pieces by Jim Grant.
3/6 Grant's argument was really simple.
The way market valuation multiple is calculated by FactSet/CapIQ can understate the "true" multiple of the market. Let me explain.
4/6 In a simple two stock index, FactSet's methodology of summing all the earnings and dividing it by market cap can significantly understate the market cap weighted P/E multiple which I believe is much more relevant.
See the image for explanation.
5/6 I don't have access to FactSet now, but I did some calculation a yr ago to understand how much multiple was understated if earnings were market cap-weighted.
On Feb 17, 2020, FactSet mentioned $SPY NTM P/E multiple to be 20.8x. When I adjusted for market cap, it became 26.3x
6/6 This is not an opinion on whether any of the big tech or overall market is overvalued/undervalued.
I'm bullish on big tech in general not because they're terribly cheap (but yes, valuation is not demanding), but because their businesses are much better than "market".
1/ I have thought about it a little more and now I'm a bit confused whether FactSet's methodology is actually better than Grant's. Let me explain what's giving me second thoughts.
2/ if we imagine overall earnings of today's market is a stable pool of total earnings that grows at a historically similar rate, it perhaps makes sense to just the total earnings of the market rather than adjusting it by their mcap weights.
3/ Companies within today's index will die or be left out and new companies will join, and overall profit pool in the economy will just shift around to companies that are creating the most value.
“The IAC Way pairs scrappiness and big ambition with the rational patience of permanent capital.”
Joey Levin is an excellent communicator. Another young CEO in early 40s who can work for shareholders hopefully for decades.
Here are my notes.
2/ “Whatever the relative point of reference: we’re back where we need to be: building”
16% CAGR since 1995 is an awesome track record in the public markets. That’s ~4x of S&P 500 over the same period.
3/ Vimeo
“Vimeo became part of IAC in 2006 through the $26 million acquisition of Connected Ventures, a collection of businesses whose main attraction for IAC was a business called College Humor.”
From 2016-2018, Etsy added 10.9 mn active buyers to its marketplace.
In the first three months of 2021 (AFTER the pandemic-fueled holiday season), Etsy added 8.8 mn active buyers *QoQ*.
Pre, and post-pandemic Etsy are truly a different marketplace.
2/ While the market seems to be focused on YoY numbers, the underlying strength of the marketplace is actually better understood by QoQ numbers.
We usually don’t look at QoQ numbers, but given we are anything but a normal comp, QoQ numbers can depict an interesting narrative.
3/ So what do I see?
I see 1Q’20 (so, pre-pandemic) was down 18% QoQ whereas 1Q’21 was down 13% QoQ.
Here’s how many active sellers have been added (again, QoQ) in the last 6 quarters:
4Q’19: 107k
1Q’20: 115K
2Q’20: 326K
3Q’20: 541K
4Q’20: 684K
1Q:21: 337K
2/6 Like most things in life, I have come to the conclusion that good marriage is part luck, and part skill.
It's very easy for happy couples to pat them on their back, but let's imagine a situation (it'll help if you don't believe in ideas such as "soul mates").
3/ If there were 10 different parallel universe and you would get married to different person in each of those universe, how many of those marriages do you think would end up in divorce?
If you're very skilled in relationship management, your probability of divorce would be low
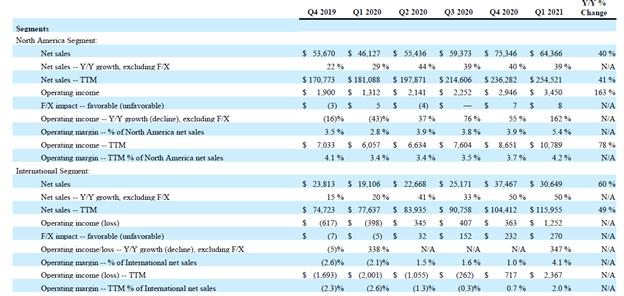
By now, it is no surprise that Amazon would post another Amazing quarter, but the growth/margin in international (+60%) and ads/other (+77%) still raised my eyebrows.
Let’s look at segment by segment and some highlights from the call.
2/ But first here’s the breakdown of revenue by segment (both product and geography)
The real surprise was how international operating margin increased from -2.6% in 1Q’20 to +4.1% in 1Q’21. That’s +670 bps margin improvement vs NA’s +260 bps during the same time.
3/ One of my concerns was whether Amazon can mimic its success in NA to international markets as well.
Looking at the operating leverage and the pace of improvement, this looks much better than I anticipated.