The second leg of the Biden tax plans targets the "rich", with a rollback in the 2017 rate cuts in the highest tax brackets and a doubling of tax rates on capital gains for the 0.3 percenters (making more than $ 1 million in investment income). bit.ly/3blbxp3
If historical stock returns in the US are adjusted for dividend and capital gain taxes, the tax impact wipes out almost 95% of the cumulative payoff. Paying a lower tax rate on dividends & trading less often reduces but does not eliminate the pain. bit.ly/3blbxp3
Prior to the tax rate change, investors are pricing stocks to earn an annual return of 5.73%, pre-taxes, and an after-tax return of 5.01%, with the current tax code. bit.ly/3blbxp3
If the proposed capital gain tax change goes through, even though it targets only a few, those few punch well above their weight, in terms of investment holdings, and the tax rate investors will need to make, in the aggregate, will go up materially. bit.ly/3blbxp3
Revaluing stocks, holding earnings and cash flows fixed, and using the higher pre-tax required return of 6.05% yield a 7.05% lower value for the S&P 500. bit.ly/3blbxp3
The bottom line. No tax hike ever hits just its intended target. The rich will feel the pain, but to assume that they will not share it with the rest of us is being in denial. Tax lawyers and accountants will clearly be beneficiaries. bit.ly/3blbxp3

• • •

Missing some Tweet in this thread? You can try to force a refresh
 

Keep Current with Aswath Damodaran

Aswath Damodaran Profile picture

Stay in touch and get notified when new unrolls are available from this author!

Read all threads

This Thread may be Removed Anytime!

PDF

Twitter may remove this content at anytime! Save it as PDF for later use!

Try unrolling a thread yourself!

how to unroll video
  1. Follow @ThreadReaderApp to mention us!

  2. From a Twitter thread mention us with a keyword "unroll"
@threadreaderapp unroll

Practice here first or read more on our help page!

More from @AswathDamodaran

23 Apr
The equity risk premium (ERP) is the price of risk in equity markets, the receptacle for all our fears. Each year, since 2008, I have updated a paper that includes everything I know about ERP. (Warning: It is 130 pages long...) Here is the 2021 version: bit.ly/2QQd3bB Image
As the ERP rises and falls, it drives what investors are willing to pay for stocks, and what companies demand as hurdle rates. Views on whether it is too high or too low determine whether stocks are collectively under or over valued. bit.ly/2QQd3bB Image
In practice, most analysts and companies estimate equity risk premiums by looking at the past (historical data), but that is not only backward looking, but it yields static and noisy estimates of the ERP, even for a market like the US, with a long history. bit.ly/2QQd3bB Image
Read 6 tweets
21 Apr
As another corporate tax code rewrite looms, both sides of the debate will present opinions as facts. I look at how much US companies pay in taxes, relative to non-US companies. At 25-27%, US statutory tax rates are in the middle of the pack: bit.ly/3v2W9oT
But US companies pay less in effective tax rates than companies elsewhere in the world, largely because of the bloat in the US tax code. bit.ly/3v2W9oT
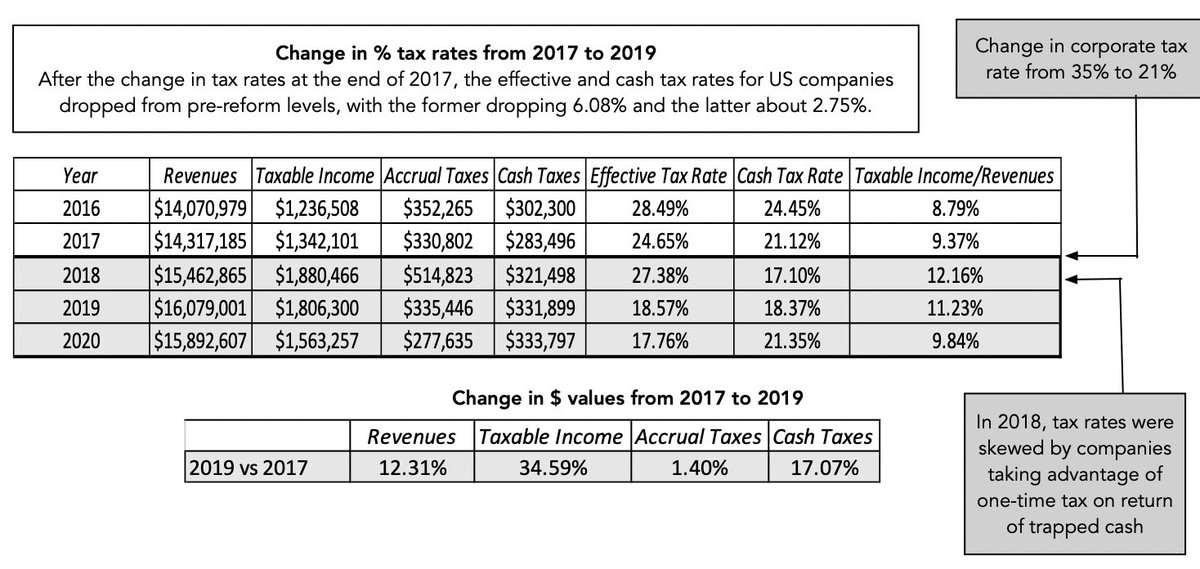
But the 2017 tax reform act rates is not to blame, for lower taxes. While effective tax rates dropped in its aftermath, taxable income increased, as did cash taxes paid. bit.ly/3v2W9oT
Read 5 tweets
9 Mar
It is hard to believe, but a year ago, we were in the middle of a market meltdown, with no end in sight. My first post on the COVID crisis was on February 26, 2020 and my fourteenth post on the crisis was November 5, 2020. I gather these posts in a paper: bit.ly/3l442qq
If you are looking for an objective, theoretical perspective, this paper will disappoint you. It is data-driven, agnostic about theory, and personal, as I draw on my real-time posts to chronicle my ups and downs during 2020: bit.ly/3l442qq
As markets made their way back in 2020, I use company-level data to chronicle the winners and losers from the crisis, by looking at market cap and operating shifts during the year, and find that the flexible & the young won out over the rigid & the old. bit.ly/3l442qq
Read 6 tweets

Did Thread Reader help you today?

Support us! We are indie developers!


This site is made by just two indie developers on a laptop doing marketing, support and development! Read more about the story.

Become a Premium Member ($3/month or $30/year) and get exclusive features!

Become Premium

Too expensive? Make a small donation by buying us coffee ($5) or help with server cost ($10)

Donate via Paypal Become our Patreon

Thank you for your support!

Follow Us on Twitter!

:(