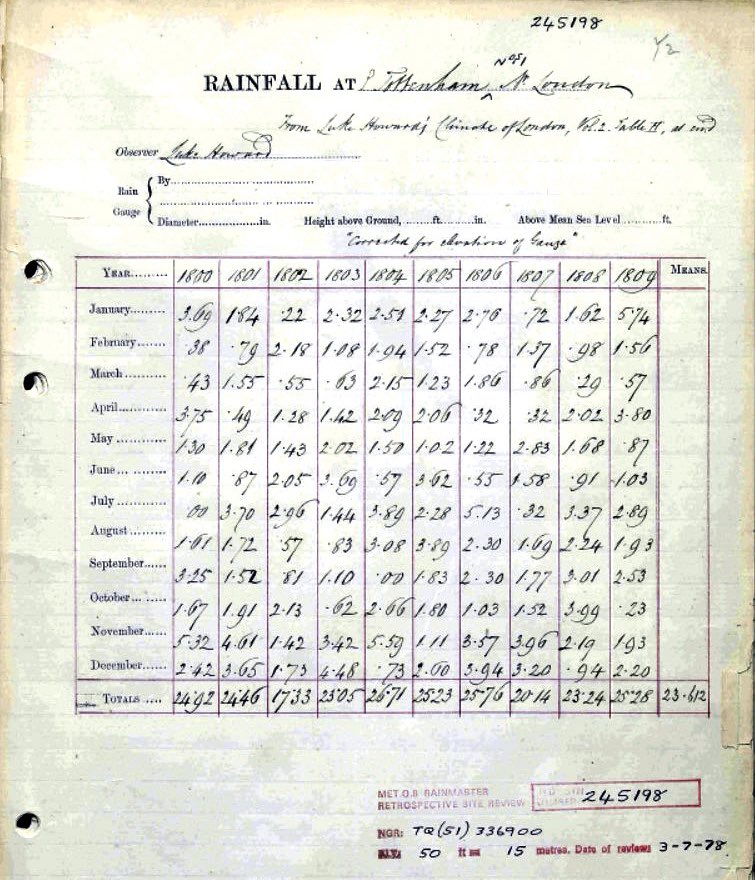
Two years ago there were 65,000 sheets of paper containing hand-written measurements of rainfall taken all across the UK & Ireland before 1960. Virtually all of the 5.28 million observations on these sheets were unavailable to climate scientists as they had never been digitised. 

Thanks to @metoffice archives, these sheets were scanned & made openly available, but how could the observations be extracted?
The answer? Ask for help: bbc.co.uk/news/science-e…
16,000 volunteers stepped forward during the first UK COVID lockdown to transcribe every observation.
The answer? Ask for help: bbc.co.uk/news/science-e…
16,000 volunteers stepped forward during the first UK COVID lockdown to transcribe every observation.
After a year of continued effort by a small team of volunteers we can now release the data!
Rainfall Rescue dataset v1.0.0:
doi.org/10.5281/zenodo…
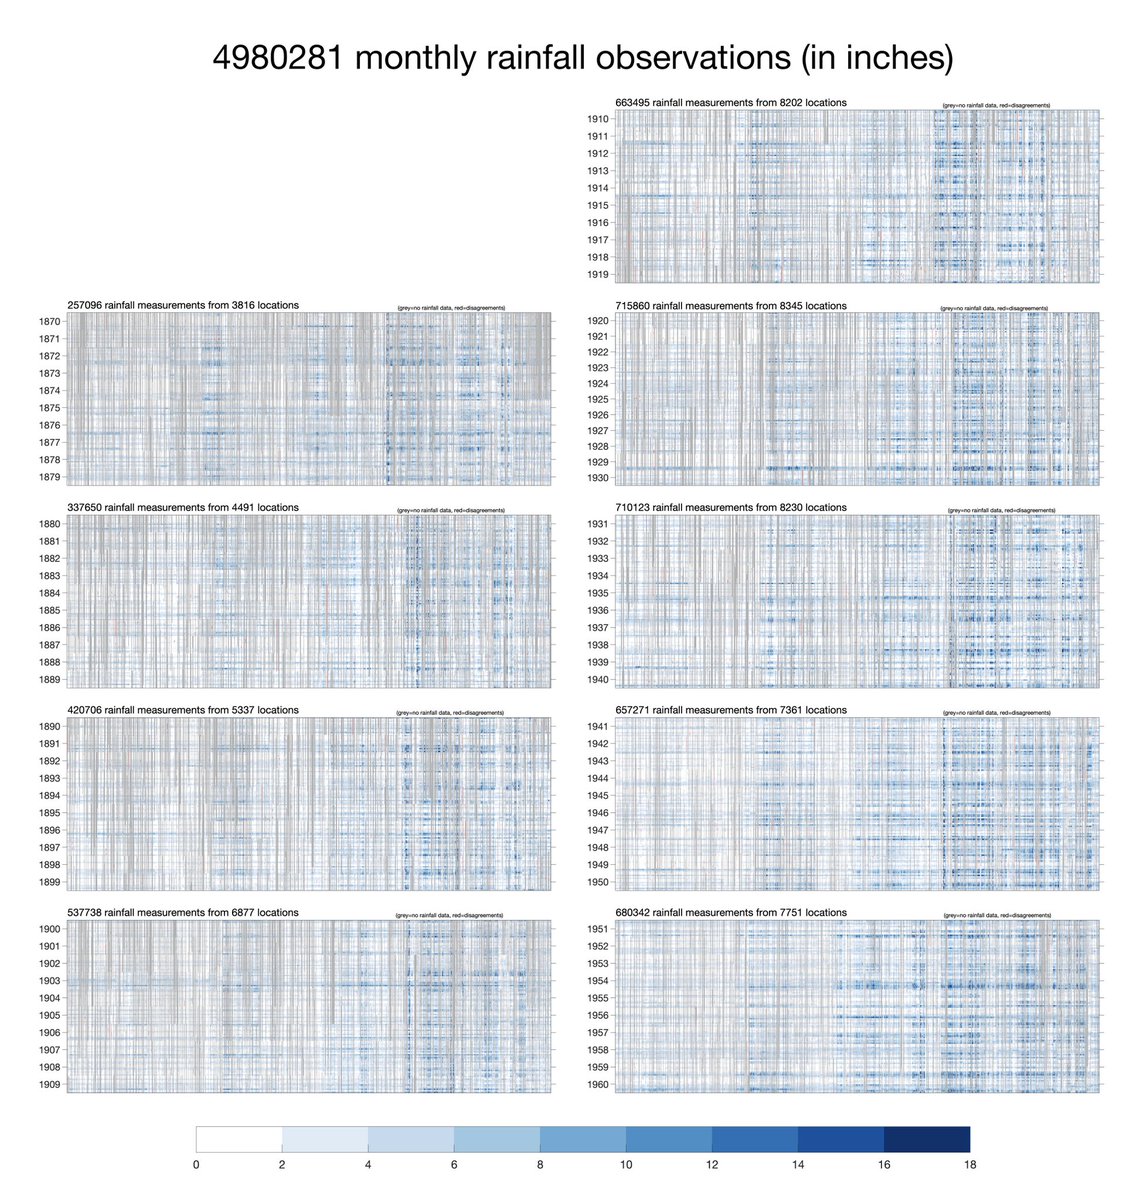
3.3 million observations have been quality controlled, and combined into time series from 8485 rain gauges from 6095 locations.
Rainfall Rescue dataset v1.0.0:
doi.org/10.5281/zenodo…
3.3 million observations have been quality controlled, and combined into time series from 8485 rain gauges from 6095 locations.

This data will be used by @markpmcc & @metoffice to improve UK rainfall reconstruction (called HadUK-Grid).
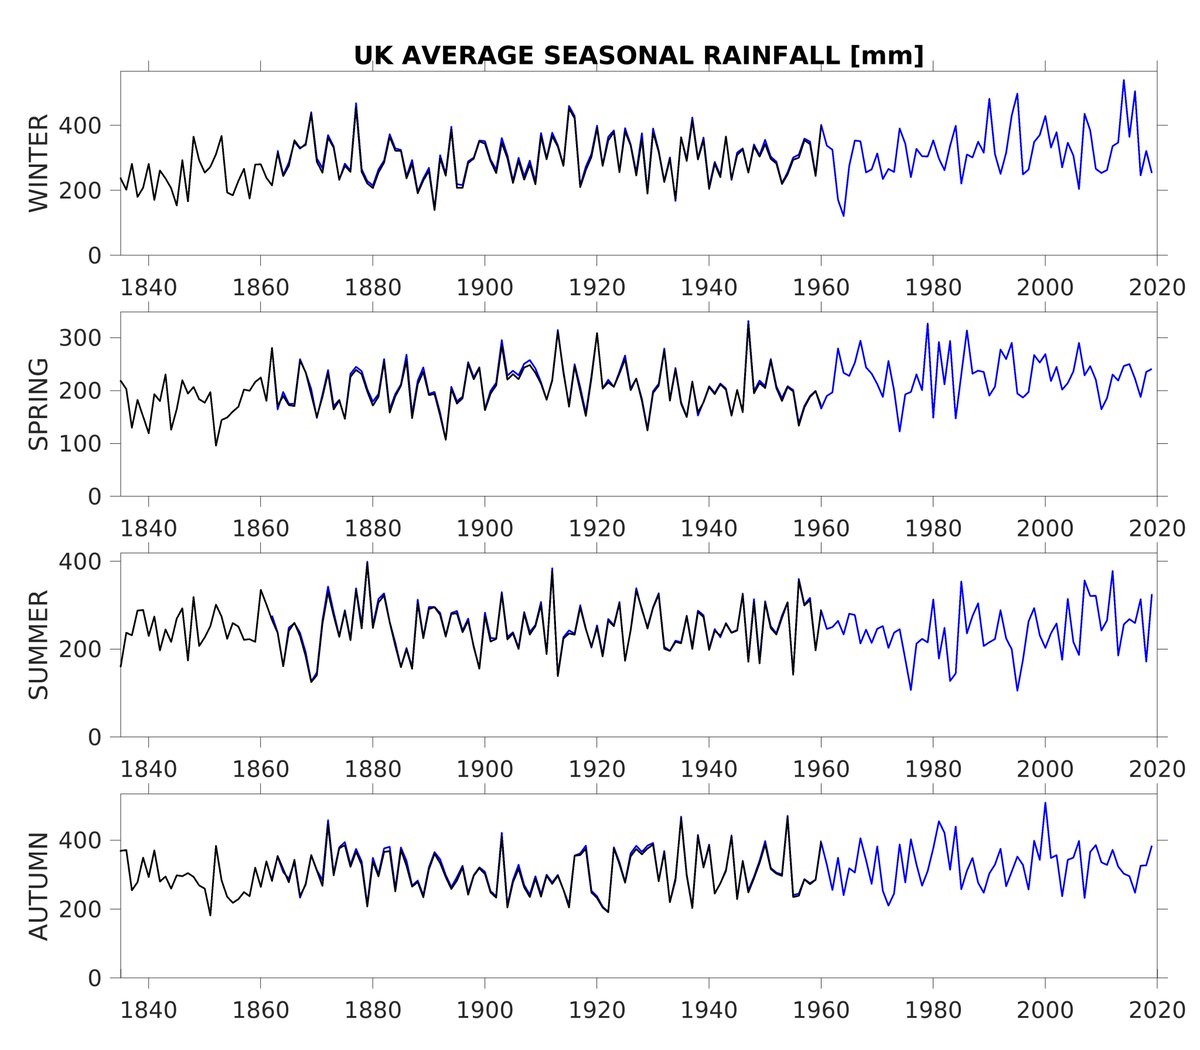
Currently the all-UK gridded reconstructions extend back to 1862. With the #rainfallrescue dataset it should be possible to go back to 1836, and earlier for some regions.
Currently the all-UK gridded reconstructions extend back to 1862. With the #rainfallrescue dataset it should be possible to go back to 1836, and earlier for some regions.

The extension back to 1836 means we can put recent UK rainfall changes into a longer-term context. The drier winters in the 1840s and 1850s will be of interest to water companies planning for worst-case drought scenarios, for example. 
None of this would have been possible without the 16,000+ volunteers, and especially those who have stayed with the project the whole way (Gill, Ian, Jacqui, John B, John O, Mike, Richard, Tim). We also relied on the amazing @the_zooniverse as the citizen science web platform.
We can now map out rainfall for historical extreme months that has never been possible before. For example, the Decembers in 1852 and 1853 were one of the wettest and driest on record for Scotland respectively. 

• • •
Missing some Tweet in this thread? You can try to
force a refresh


