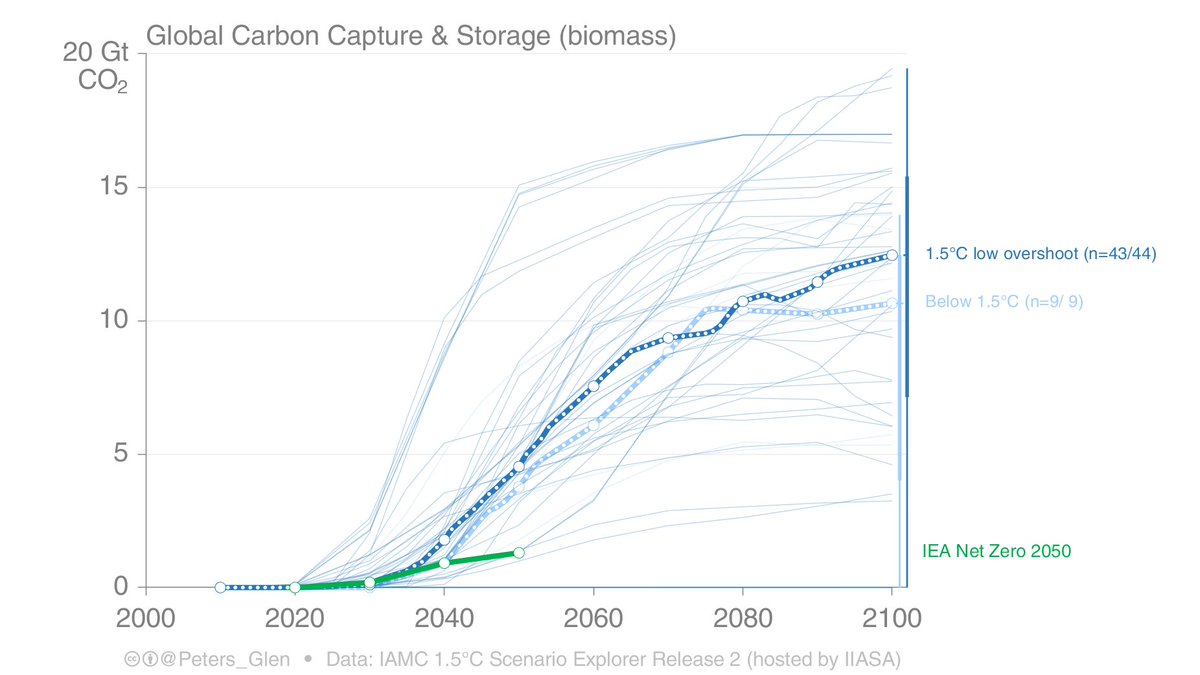
The IEA, in contrast, has a decent (not huge) amount of Direct Air Capture (DACCS) of 0.6GtCO₂/yr.
Not many scenarios assessed by the IPCC SR15 use DACCS (4 out of 53 have non-zero data, the other 2 marked have zero DACCS)
The scenario with high DACCS is from MERGE-ETL.
2/
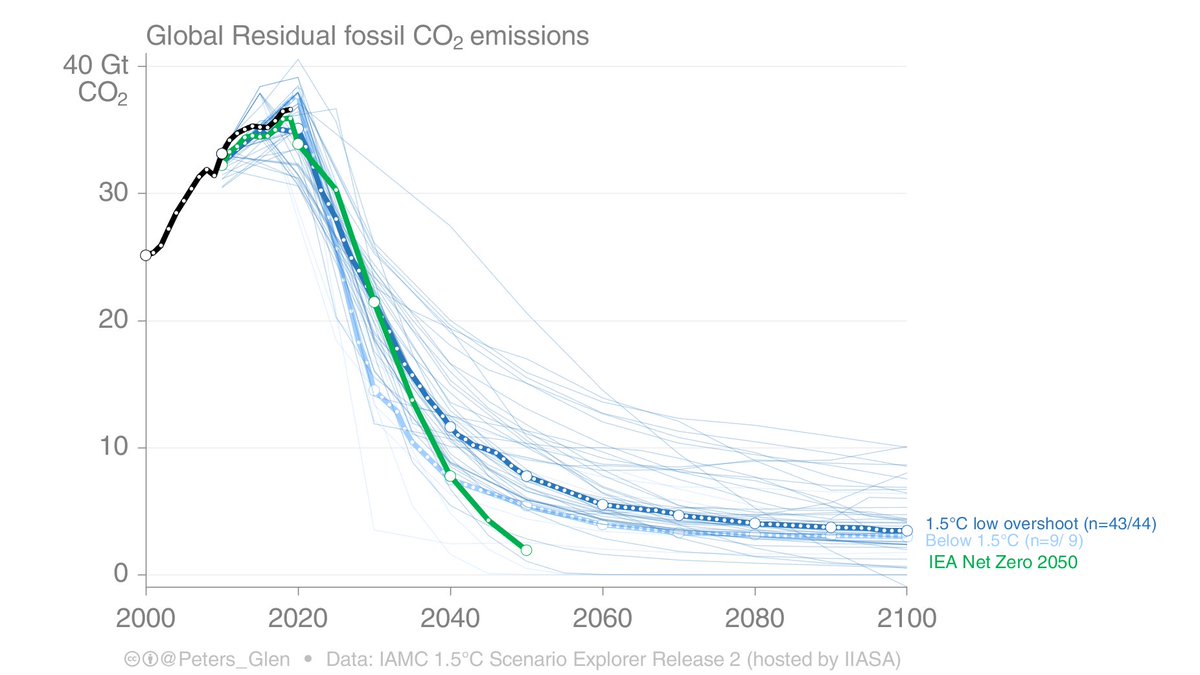
Since IEA NZE2050 reaches net-zero CO₂ emissions in 2050, the removals (tweets 1 & 2) must balance with (residual) emissions in 2050.
The NZE2050 clearly has far less fossil fuel use in 2050 than most IPCC SR15 assessed 1.5°C scenarios.
3/
Adding the emissions (tweet 3) & removals (tweet 1 & 2) leads to net CO₂ emissions.
The IEA NZE2050 is well within the cloud of other 1.5°C scenarios, towards the lower end, but with a lot less fossil fuel use.
4/
The NZE2050 still uses a decent amount of standard Carbon Capture & Storage (~7.6GtCO₂/yr in 2050), which is less than the median in IPCC assessed 1.5°C scenarios, but still a large amount.
5/
Most of the CCS is on industry, & the CCS on fuel supply is mainly hydrogen or biofuels production.
6/
You can find a lot of data and information in the IEA NZE2050 report, which is freely downloadable.
Though, the format of the data makes it a little challenging to get into plotting code - to put it diplomatically (cc @IEA, @daniel_huppmann)
The new @IEA Net Zero by 2050 report is crystal clear on what is needed.
"All the technologies needed to achieve the necessary deep cuts in global emissions by 2030 already exist, & the policies that can drive their deployment are already proven."
"Clean energy innovation must accelerate rapidly, with governments putting R&D, demonstration and deployment at the core of energy and climate policy."
In 2030 only existing technologies needed, by 2050 new technologies also come to market.
2/
Net Zero 2050 is a jobs bonanza.
JOBS. JOBS. JOBS.
"The transition to net zero brings substantial new opportunities for employment, with 14 million jobs created by 2030 in our pathway thanks to new activities and investment in clean energy"
Norwegian electricity production is dominated by hydropower, & overall Norway is a net exporter of electricity (though, this varies throughout the year).
Hydropower production varies due to weather (green), but consumption is relatively constant (black line).
1/
Total energy consumption is dominated by hydropower (figure shows generation, not consumption).
Nearly all the oil is used in transport, and nearly all the gas is used in oil & gas extraction.
Norway is already quite electrified...
2/
The energy flow is dominated by electricity (hydropower, split between dispatchable & non-dispatchable).
As time passes, this figure will become even more dominated by electricity. Current policy is to electrify transport & oil & gas production...
There is a lot of confusion about net-zero GHG & CO₂ emissions, they are different.
The EU & US have a target of net-zero GHG emissions in 2050, which is ~20 years ahead of the global average (coincidentally, global net-zero CO₂ emissions is ~2050).
1/
For developing countries to have a later net-zero GHG year, say 2090 (~20 years after the global average), it requires that developed countries are net negative to compensate developing countries & maintain net-zero GHG globally. (a point often made by @Oliver_Geden).
2/
I think we all agree & accept developing countries will find their own path to net-zero, & one that is later than developed countries.
But, I also think many confuse the net-zero years for CO₂ & GHG emissions.
Many obsess on 2050, when there is actually a broad range!
A 🧵 on carbon budget uncertainties (for walkers)...
It is 2km to the lake, which means it could be 1.5km or 2.5km given rounding.
If I have walked 1km, then it is 0.5km to 1.5km to go. That is a huge uncertainty!
1/
Carbon budgets are often presented for 66% chance (of avoiding the target), which in this analogy, would say after 1km that if I walk 0.5km further there is a 66% chance I have not reached the lake.
Or after 1.5km, there is a 33% change I have still not reached the lake!
2/
There are a few issues here. There will be a non-zero probability I have reached the lake after only 1km, which means the measurements were wrong.
Carbon budget uncertainties for 1.5°C also include negative carbon budgets, meaning it may already be too late to avoid 1.5°C!
3/
Keeping below 1.5°C requires rapid emission reductions at the global level.
What do scenarios imply for key regions?
In this thread, I show the fossil CO₂ emissions in key regions. These scenarios do not include equity considerations, these are cost-efficient pathways.
1/
2. In the OECD, fossil CO₂ emissions are are already in a decline.
On average, from 2020, a 44% reduction by 2030 & 95% by 2050. This requires accelerating climate action beyond current levels.
3. Asia is a big challenge. Emissions are growing strongly now, but has to drop by 47% from 2020 to 2030 & by 88% to 2050.
This requires a dramatic reversal of current trends. In many respects, this makes the challenge harder in Asia (developing) compared to OECD (developed).