
0/17 Probably should make a thread on why Elon and Retail are not the culprits, but scapegoats...
Here it is 🧵👇
Here it is 🧵👇

1/17 Call it a Wyckoff… Call it a distribution top pattern… Call it whales unloading on retail… Call it miners selling... Call it OTC desks wanting lower prices…
It's all accurate.
It's all accurate.
2/17 Only thing inaccurate is saying retail or Elon caused it.
Instead, there was a trifecta at play that led to current prices.
Whales, miners, market movers.
Instead, there was a trifecta at play that led to current prices.
Whales, miners, market movers.
3/17
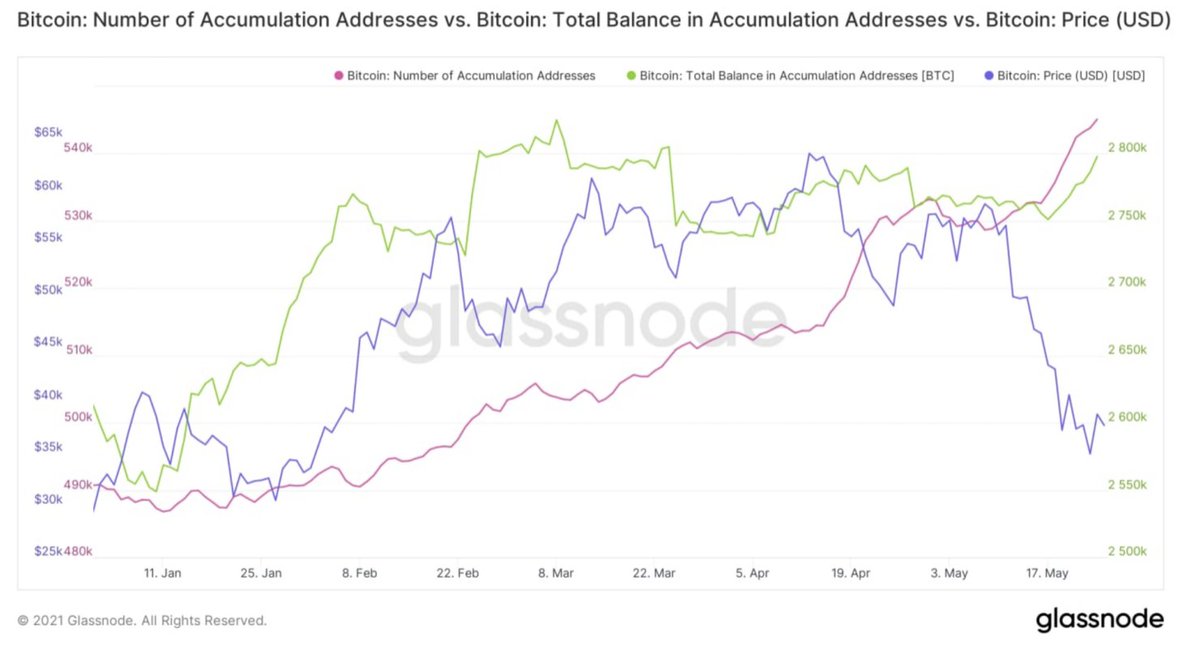
Whales: Mid-Feb to the selloff, the total balance of accumulation addresses stalled out. This is the green line in the chart. Blue is price.
Meanwhile, the # of accumulation addys rose.
How does the # of addys grow while the balance of BTC in these addys go sideways?
Whales: Mid-Feb to the selloff, the total balance of accumulation addresses stalled out. This is the green line in the chart. Blue is price.
Meanwhile, the # of accumulation addys rose.
How does the # of addys grow while the balance of BTC in these addys go sideways?
4/17
Change in hands.
Here are some demographics of large wallets. Each show decreasing supply over the course of March, April, and May.
Change in hands.
Here are some demographics of large wallets. Each show decreasing supply over the course of March, April, and May.

5/17
The entities picking up the sold BTC were smaller wallets.
While that’s not enough to pick up the 100k+ of BTC that hit the market... It shows that those with smaller balances were accumulating while those with larger wallet sizes were no longer accumulating.
The entities picking up the sold BTC were smaller wallets.
While that’s not enough to pick up the 100k+ of BTC that hit the market... It shows that those with smaller balances were accumulating while those with larger wallet sizes were no longer accumulating.

6/17
Its how we can call this sideways pattern a distribution event of larger wallets to smaller. And over time this isn’t sustainable in terms of price. You need large wallets driving demand to get higher prices.
Its how we can call this sideways pattern a distribution event of larger wallets to smaller. And over time this isn’t sustainable in terms of price. You need large wallets driving demand to get higher prices.
7/17
Miners
From May 11th to 16th miner wallets were ‘spending bitcoin’.
So we had whales selling and miners selling at that point.
Miners
From May 11th to 16th miner wallets were ‘spending bitcoin’.
https://twitter.com/Jarvis_Labs_LLC/status/1396536604362113025?s=20
So we had whales selling and miners selling at that point.
8/17
Market Movers
The most notorious of which is Pablo. He was a big component of the Covid crash in March last year. He or She was active again this time.
Market Movers
The most notorious of which is Pablo. He was a big component of the Covid crash in March last year. He or She was active again this time.
9/17
It appears the entity was testing support around $50k whenever we approached it during the last few months. They tested it again as price drove towards $50k in the lead up to Elon’s tweet. Then after Elon's tweet, the movements escalated.
It appears the entity was testing support around $50k whenever we approached it during the last few months. They tested it again as price drove towards $50k in the lead up to Elon’s tweet. Then after Elon's tweet, the movements escalated.
10/17
Pablo wasn't alone as market movers aggressively attacked the softness in price.
Does this explain it? Maybe, not sure.
Pablo wasn't alone as market movers aggressively attacked the softness in price.
Does this explain it? Maybe, not sure.
https://twitter.com/twocommapauper/status/1397106939193085952
11/17
What this boils down to is whales were selling for a while. Miners were also selling before Elon tweeted. And sharks (market movers) attacked the softness in the market that was building from whales and miners selling.
What’s more, retail did not sell on the Elon tweet.
What this boils down to is whales were selling for a while. Miners were also selling before Elon tweeted. And sharks (market movers) attacked the softness in the market that was building from whales and miners selling.
What’s more, retail did not sell on the Elon tweet.
12/17
Further, this was spot driven. Many say leverage was to blame. But here’s a quick stat
On April 17th there were $9 billion worth of BTC liquidated. On that day price -15%.
The day of Elon’s tweet $7 billion was liquidated. Price -35%. And that was AFTER bitcoin fell 23%.
Further, this was spot driven. Many say leverage was to blame. But here’s a quick stat
On April 17th there were $9 billion worth of BTC liquidated. On that day price -15%.
The day of Elon’s tweet $7 billion was liquidated. Price -35%. And that was AFTER bitcoin fell 23%.
13/17
Over 100k bitcoin flooded the market, which is more than 4 months supply.
100x leverage is not to blame like some industry veterans are quick to blame.
Over 100k bitcoin flooded the market, which is more than 4 months supply.
100x leverage is not to blame like some industry veterans are quick to blame.
14/17
Whales, sharks and miners drove prices lower via spot markets. They got their dream of exiting at high prices. But will they return, and if they do, will go up?
Whales, sharks and miners drove prices lower via spot markets. They got their dream of exiting at high prices. But will they return, and if they do, will go up?
15/17
In the chart below the number of accumulating addys (blue), total balance of accumulating addresses (green), and one whale demographic (red: 1k-10k size) is accumulating.
In the chart below the number of accumulating addys (blue), total balance of accumulating addresses (green), and one whale demographic (red: 1k-10k size) is accumulating.

16/17
This is encouraging for the long-term bull cycle viewpoint to remain in tact.
These are good developments here. And it tells us we can have a strong second half to this bull run. It’ll just take time to warm up the engine again and the market to find solid footing.
This is encouraging for the long-term bull cycle viewpoint to remain in tact.
These are good developments here. And it tells us we can have a strong second half to this bull run. It’ll just take time to warm up the engine again and the market to find solid footing.
17/17
If you enjoyed this, be sure to read the whole article below, and subscribe to get insights like this delivered to your inbox every weekday.
Thanks for reading🙏
jarvislabs.substack.com/p/the-scapegoa…
If you enjoyed this, be sure to read the whole article below, and subscribe to get insights like this delivered to your inbox every weekday.
Thanks for reading🙏
jarvislabs.substack.com/p/the-scapegoa…
• • •
Missing some Tweet in this thread? You can try to
force a refresh


