1/25 @BitcoinMagazine just posted the first edition of a new monthly series titled 'Cycling On-Chain', in which on-chain and price-related data are used to estimate where in #Bitcoin's market cycle we are
I'll summarize the article in this 🧵
bitcoinmagazine.com/markets/bitcoi…
I'll summarize the article in this 🧵
bitcoinmagazine.com/markets/bitcoi…
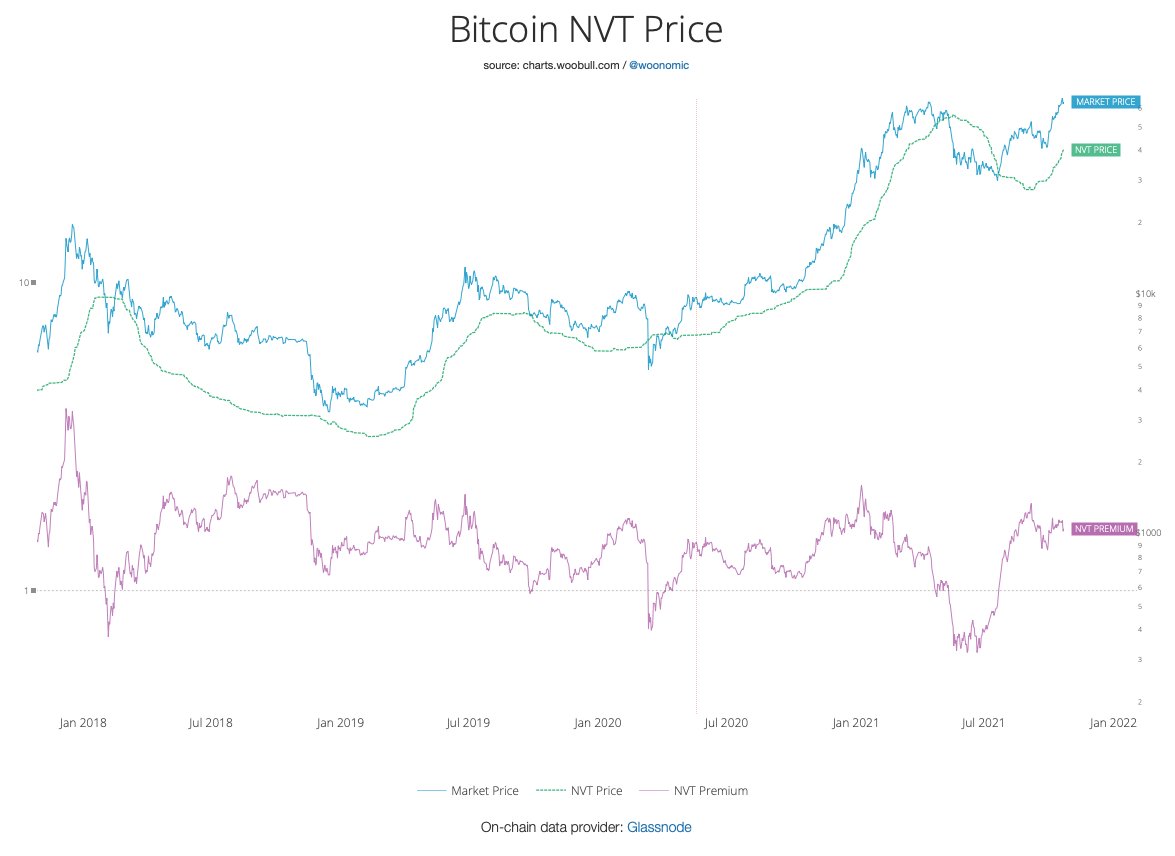
2/25 Just like the periods after the 2012 and 2016 halvings, the 2020 #Bitcoin halving created a supply shock that triggered an exponential price increase
However, compared to the previous one, this cycle got heated much faster 🥵
However, compared to the previous one, this cycle got heated much faster 🥵

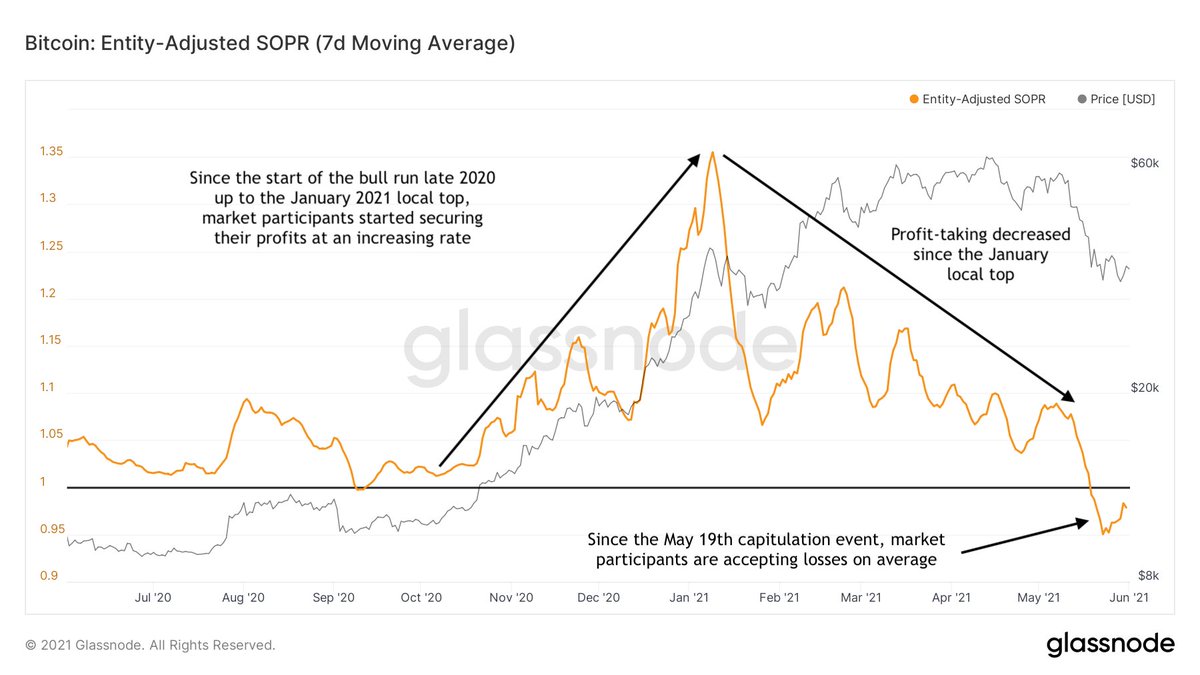
3/25 When the #bitcoin price ran towards and beyond its previous (2017) all-time high at $20k, market participants increasingly started to secure profits
After the January local top, this profit-taking has been decreasing - despite price still grinding up until recently
After the January local top, this profit-taking has been decreasing - despite price still grinding up until recently
4/25 During these exponential price increases, long-term #bitcoin holders start to gradually sell, while new market participants actually start building their participants (red columns)
...until the market cycle reaches a top and both parties switch roles ♾
...until the market cycle reaches a top and both parties switch roles ♾

5/25 If we zoom in, we see that long-term #bitcoin holders were mostly selling up to the January local top, slowed down their spending afterwards and turned into net accumulators again during this price dip

6/25 A similar trend can be witnessed in the net position change of #bitcoin miners - another class of market participants with clear long-term market experience and exposure

7/25 Since the March 2020 macro-driven market crash, (spot) exchanges' #bitcoin reserves are shrinking, suggesting that a massive supply shock may (have been) forming

8/25 However, since approaching the (2017, $20k) ATH, exchanges that offer derivative products have seen massive increases in their reserves 😯
This may be a sign that #bitcoin market participants may have gotten increasingly comfortable taking risks throughout this bull-run
This may be a sign that #bitcoin market participants may have gotten increasingly comfortable taking risks throughout this bull-run

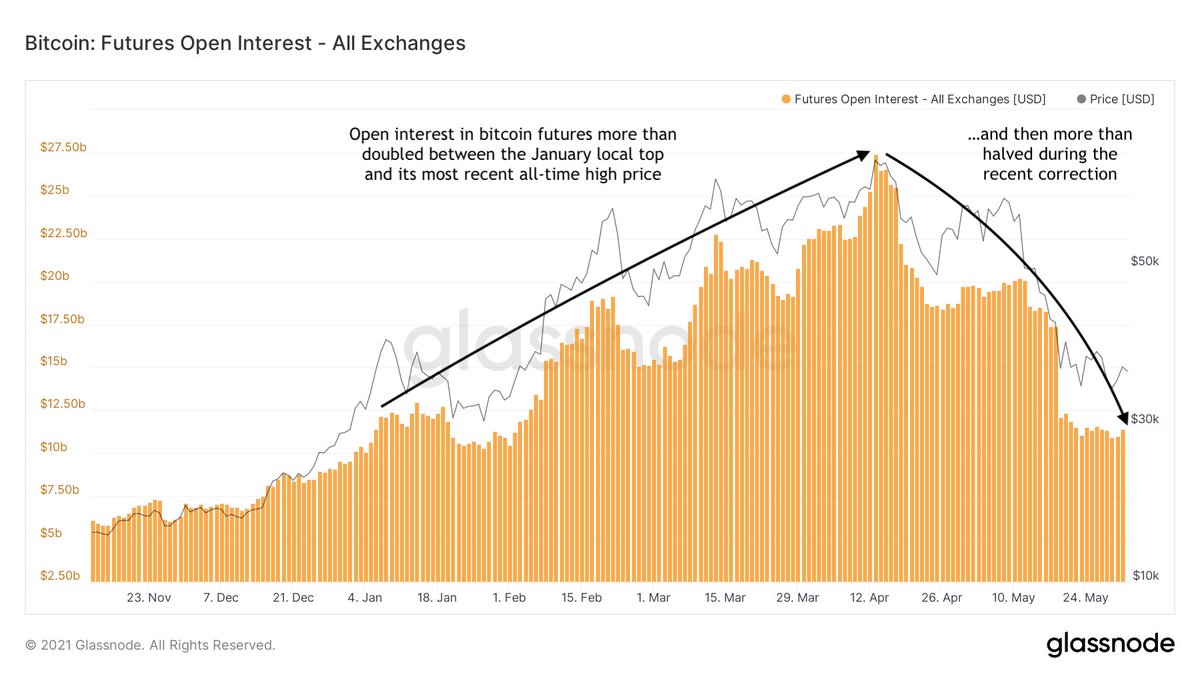
9/25 The increase in open interest on #bitcoin futures illustrates that derivative exchange inflows were (also) used for leveraged trading
Open interest more than doubled in the months after the January local top - before being cut in half again during the recent correction 😬
Open interest more than doubled in the months after the January local top - before being cut in half again during the recent correction 😬
10/25 The #bitcoin futures' open interest inflows in Jan-Apr was mostly representing long positions
The market got (over)leveraged into one direction, providing an incentive for larger market participants to push the price and create a cascading effect of long liquidations 🪦
The market got (over)leveraged into one direction, providing an incentive for larger market participants to push the price and create a cascading effect of long liquidations 🪦

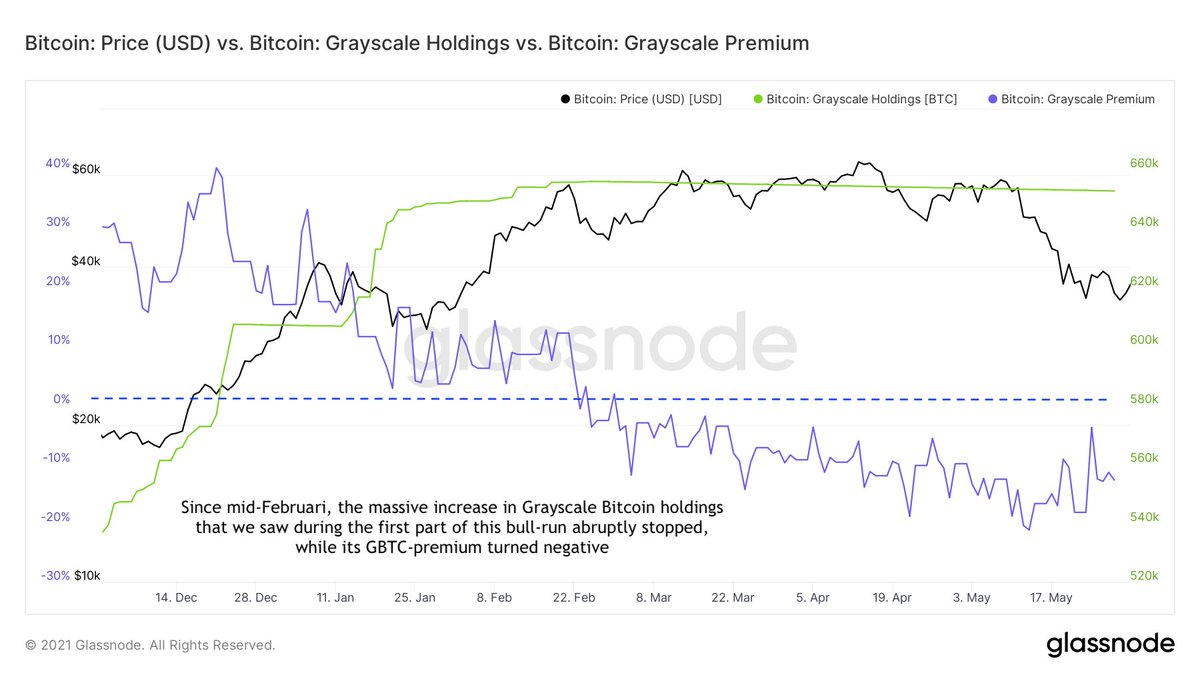
11/25 During the first quarter of 2021, there also was a change of scenery regarding who were active on the #bitcoin market
For example, @Grayscale was onboarding lots of institutions in 2020 via $GBTC but saw its holdings go flat and its premium drop negative since Februari
For example, @Grayscale was onboarding lots of institutions in 2020 via $GBTC but saw its holdings go flat and its premium drop negative since Februari
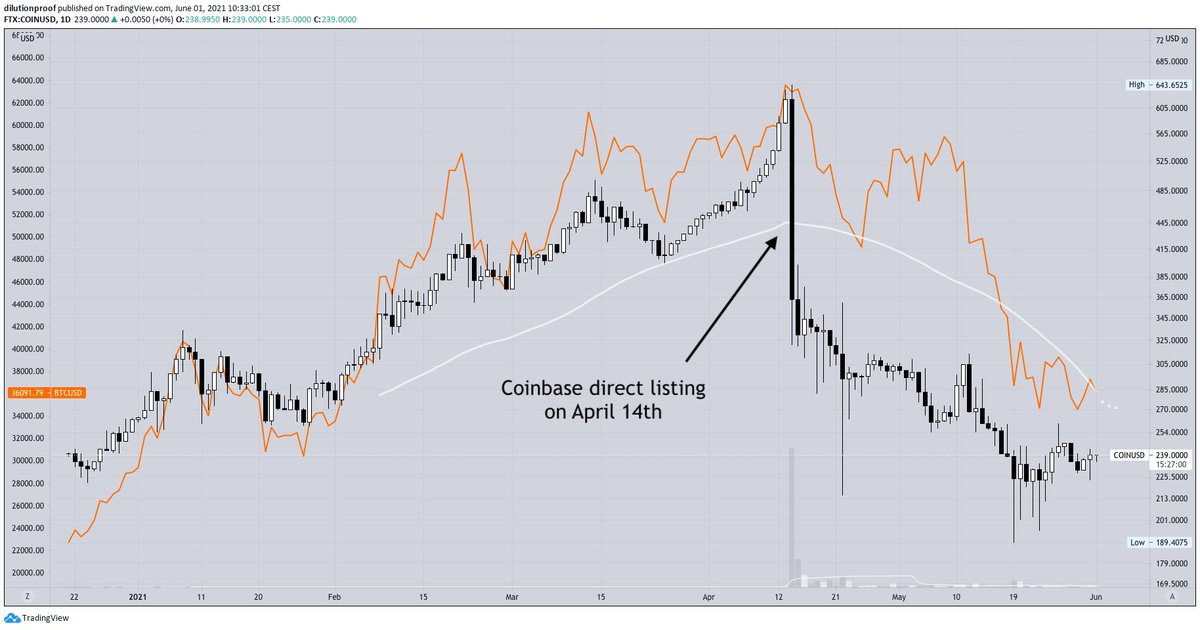
12/25 During Q1 2021 there was also a lot of speculation & anticipation about the @coinbase direct listing
On April 14th there was sell pressure from executives & early investors that utilized the liquidity event, marking the current ATH for both $COIN shares & #bitcoin itself
On April 14th there was sell pressure from executives & early investors that utilized the liquidity event, marking the current ATH for both $COIN shares & #bitcoin itself
13/25 Another change in scenery since the January local top is the declining #bitcoin dominance - a sign that (most likely retail) investors massively started looking for investment opportunities, actually creating circumstances for altcoins to (temporarily) outperform #bitcoin

14/25 Since the January local top, there is a declining trend in the degree in which older coins contribute to #bitcoin's on-chain volume
This means that recent price movements are increasingly attributed to younger coins, and thus by proxy more inexperienced market participants
This means that recent price movements are increasingly attributed to younger coins, and thus by proxy more inexperienced market participants

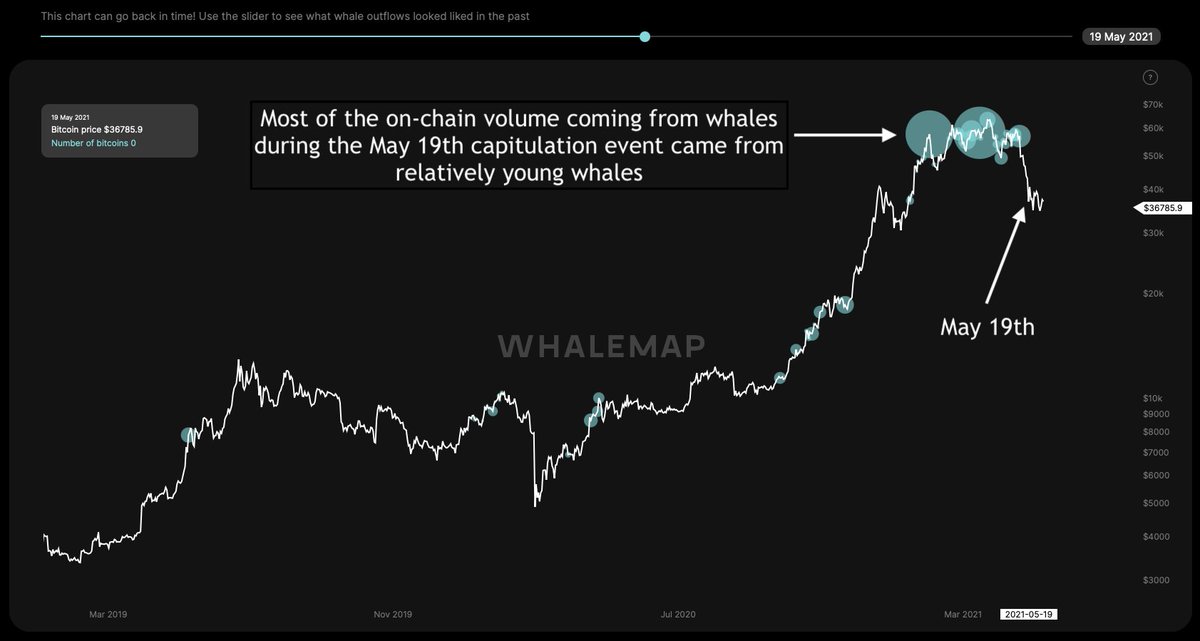
15/25 If we zoom in on the behavior of just the largest players on the market (whales), we also see that particularly younger whales were active recently 🐳
This can be (1) triggering the crash itself 👿, (2) selling 😱, (3) getting liquidated 🪦 or (4) tax harvesting 🧑🌾
This can be (1) triggering the crash itself 👿, (2) selling 😱, (3) getting liquidated 🪦 or (4) tax harvesting 🧑🌾
16/25 The big question: is the party now over? ☹️
We can't predict the future with this data, but if this was the end of this cycle, it would be the first market cycle top without an exponential blow-off top and long-term #bitcoin holders massively selling into market strength
We can't predict the future with this data, but if this was the end of this cycle, it would be the first market cycle top without an exponential blow-off top and long-term #bitcoin holders massively selling into market strength

17/25 It is impossible to predict future demand, but there are signs that there still is active demand for #bitcoin
During the market crash there were large exchange inflows, but net flows turned negative during the dip, a possible sign of accumulation at discounted prices 💸
During the market crash there were large exchange inflows, but net flows turned negative during the dip, a possible sign of accumulation at discounted prices 💸

18/25 The large Over The Counter (OTC) trading desk outflows that we saw during this dip give a similar indication
These OTC desks facilitate one-on-one trading for larger entities looking to buy or sell #bitcoin without moving the market
These OTC desks facilitate one-on-one trading for larger entities looking to buy or sell #bitcoin without moving the market

19/25 Another possible sign of continued demand for (spot) exposure to #bitcoin are the stablecoin reserves on spot exchanges that have continued to go up during this dip
(Could be used for collateral and altcoin exposure as well, but likely also includes demand for #bitcoin)
(Could be used for collateral and altcoin exposure as well, but likely also includes demand for #bitcoin)

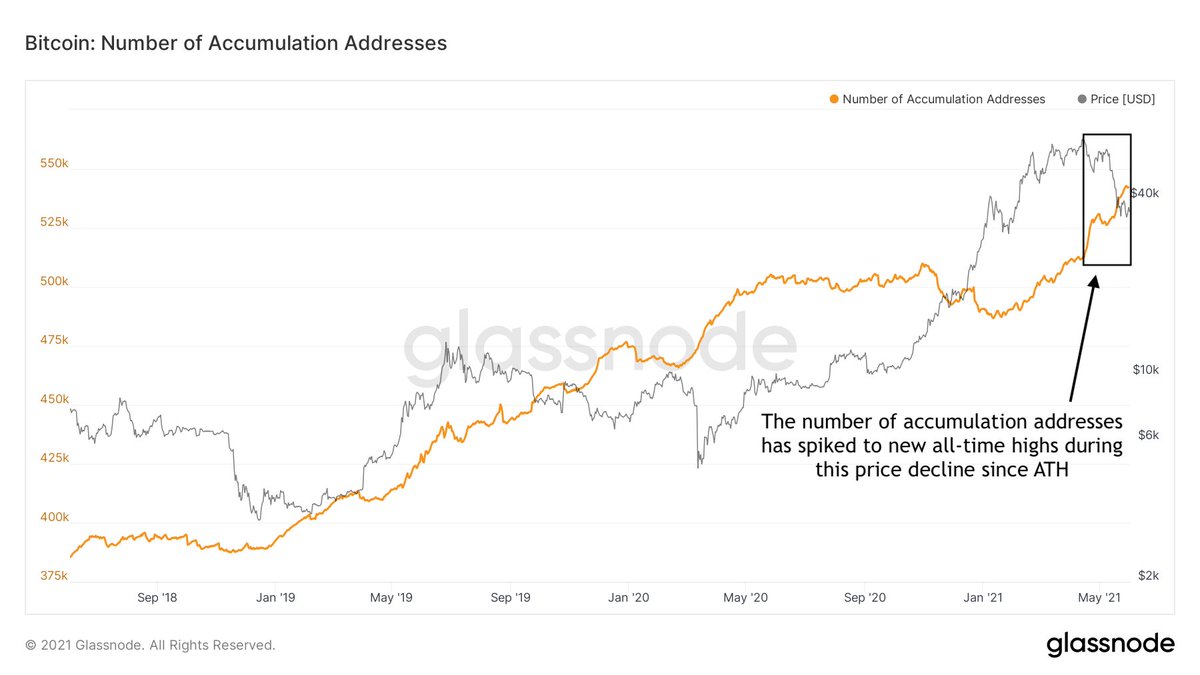
20/25 Based on the number of accumulation addresses recently peaking to new all-time highs, the price dip also appears to have triggered new market participants to Dollar Cost Average (DCA) into a #bitcoin position
21/25 Finally, the recent spike in the net growth of entities on the #Bitcoin network suggests that during the price crash (much) more entities joined than left, also suggesting that the lower prices enticed new people to buy into a position

22/25 Twitter polls need to be taken with a grain of salt (selection bias?), but these May 31st poll results suggest that #bitcoin market participants are mostly neutral to mildly bullish on a weekly to monthly timeframe, but still very bullish on a yearly timeframe 🐂

23/25 Besides price-related interest in #bitcoin, its Taproot protocol upgrade might provide an actual fundamental driver for enthusiasm on its prospects
Most likely, Taproot activation will be locked in within 2 weeks, which would mean that it will be activated in November 🥕🟩
Most likely, Taproot activation will be locked in within 2 weeks, which would mean that it will be activated in November 🥕🟩

24/25 A note of caution is in place though 🤔
#Bitcoin is now operating on a different (macro-asset) level, which means that regulatory headwinds can occasionally bring fear in the markets
Another consequence is that it can go down during a macro-breakdown (like March 2020)
#Bitcoin is now operating on a different (macro-asset) level, which means that regulatory headwinds can occasionally bring fear in the markets
Another consequence is that it can go down during a macro-breakdown (like March 2020)
25/25 There are no guarantees that the #bitcoin price will mimic the trajectories of its previous halving cycles, but if it does, the S2F, S2FX, time-based model and halving cycle indexes may provide a rough indication (each model has its own limitations) of what may be next 👀

• • •
Missing some Tweet in this thread? You can try to
force a refresh