
This is possibly the most ridiculous thing I've seen here in a long time. A map showing very little correlation, no consideration of population density and no attempt to discuss the actual nature/reason of the protest. Correlation does not equal causation.
https://twitter.com/marcosanfilip/status/1391685763180470273
Reminds me of this... tylervigen.com/spurious-corre…
Apologies, I now have a link to a free version of the paper, where it has become clearer that an attempt at causal connection has been made. sciencedirect.com/science/articl…
It seems a key issue is the hypothesis that increased financial input for projects from China leads to a greater mistrust in the local government.
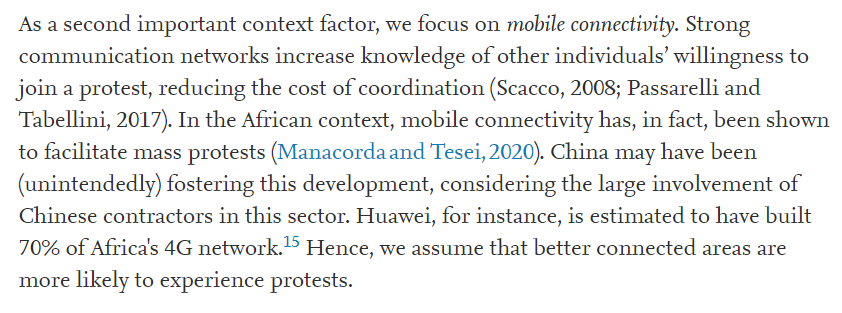
One of the key factors in mass protest is mobile connectivity, something which is obviously better in more developed areas, and partly China's fault... 
Another key factor involved is the level of 'democracy' in a country. The suggestion is that more 'democratic' countries experience more protests.
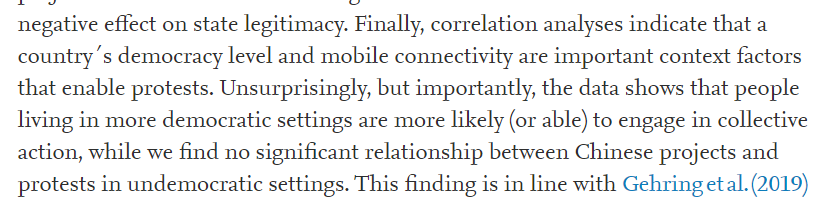
Apparently, this is China's fault as well for the policy of non-interference in the political structure of a country instead of imposing external conditions on these sovereign countries.

If a protest lasts for more than 1 day it is counted repeatedly as separate protests.

One of the authors was unable to go into detail about the content of the protest, despite the fact that the data source used has this as a search option.


Here's an example of one year (2011) in the timescale analysed. The links show where the protest happened and which other country it is associated with.

"We know something on their socio-economic effects already..". Yes *we* do - your 3 co-authors looked into this recently.


This gets better. Apparently the population density map only overlaps with the red dots (protests) but not the green (projects). How then do the green and red overlap?

• • •
Missing some Tweet in this thread? You can try to
force a refresh


