Did LDs work?

To Jun11 for🏴󠁧󠁢󠁥󠁮󠁧󠁿
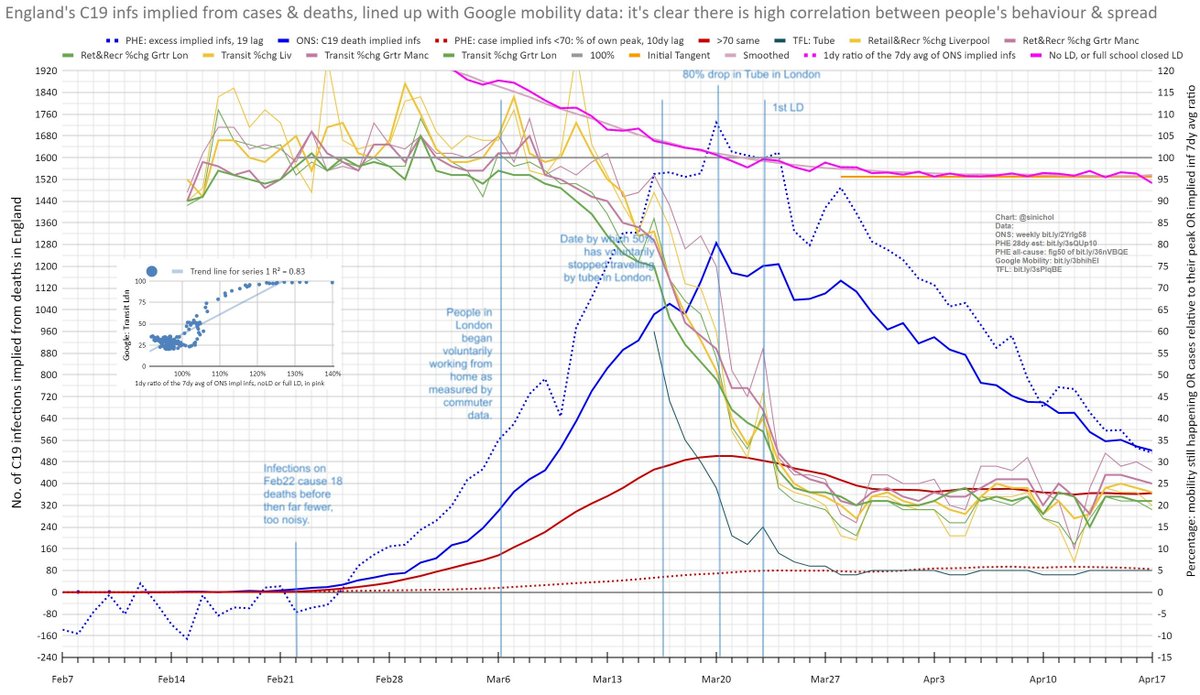
👉Lon/Manc/Liv Google Mobility
👉Infs implied from ONS/PHE deaths/cases
👉Gradient of infs from deaths
👉Its correl to Lon mobility
Plotting detail👇


LD rsq 0.82, high

Do infs fall before LDs?
If we look at each LD...

1/5
Taking each LD in turn.

👉1stLD: as this zoom in shows, its reduction occured before so was voluntary, fear induced, but without furlough, and business grants, how could it have been sustained without bankruptcy? If we compare on this outcome to 🇸🇪, our strategy was better.

2/5
👉pre 2ndLD: Liv/Manc were main drivers of deaths going into Tier3++ LD in Sept/Oct, with Liv cases peaking Sep28, hence UK deaths flattening before 2nd LD, mobility clearly fell in both

👉2ndLD: had schools open, so saw less mobility drop, borderline enough to turn infs

3/5
👉pre 3rdLD: per these inlaid maps, Tier4+SchoolsClosed spread across the UK from Dec20. It seems clear compliance was voluntarily around Xmas with the mobility drop stabalising by Dec28

👉3rdLD: Jan4 did not change mobility level, furlough/grants have sustained this since

4/5
It's clear LDs lowered mobility. Annoying only full LDs with school closures, 1st/3rd, solidly turned infs.

But, the 2nd LD was enough, until the Kent variant.

With better adherence to lesser NPIs, masks etc, could we have made tiered local with schools open work?

5/5

• • •

Missing some Tweet in this thread? You can try to force a refresh
 

Keep Current with Simon Nicholls

Simon Nicholls Profile picture

Stay in touch and get notified when new unrolls are available from this author!

Read all threads

This Thread may be Removed Anytime!

PDF

Twitter may remove this content at anytime! Save it as PDF for later use!

Try unrolling a thread yourself!

how to unroll video
  1. Follow @ThreadReaderApp to mention us!

  2. From a Twitter thread mention us with a keyword "unroll"
@threadreaderapp unroll

Practice here first or read more on our help page!

More from @sinichol

11 Feb
We've all sorted worldometer's table by deaths/1m, seen the data in the blue bars (to Feb6), and thought, wow 🇬🇧's pretty bad.

But, we're all getting our comparisons so wrong.
i.e. red bars are d/1m just for 50-59yr olds.

Why so different?

Follow me to open your eyes.

1/10 Image
Main cause, 2🔑factors:
▶️Demographic: a pop's d/1m figure is still wgted by age, so fewer 80+ it's lower
▶️Policy: e.g. 🇩🇪's just managed spread better

Re-ranking most2least aging, a pattern emerges.

For a younger pop to have a high d/1m, it's had more spread & deaths.

2/10 Image
So how much do demographics vary?

Here for:
▶️the countries so far
▶️adding a few more
▶️plus, the world
Are the props. each 10yr age band make up.

50% marks median age, so:
Italy 🇮🇹 47
Eng🏴󠁧󠁢󠁥󠁮󠁧󠁿&Wal🏴󠁧󠁢󠁷󠁬󠁳󠁿 41
🌍 30
Nigeria🇳🇬 just 18

So expecting similar deaths overall is silly.

3/10 Image
Read 11 tweets
14 Jan
Most 🌍 comparisons for C19 go wrong as they don't considering demographics.

For countries I've managed to src detailed death data for, here's total d/1m numbers.

Sure,🏴󠁧󠁢󠁥󠁮󠁧󠁿🏴󠁧󠁢󠁷󠁬󠁳󠁿 look similar to 🇧🇷🇵🇪, but just look at the differences <60, 🇵🇪 4x larger.

So what does this mean?

1/9 Image
Basically, fewer >80, means they've had⏫spread, and ⏫younger deaths, but👀equal.

Here ranking⏫2⏬by age are:
▶️20 countries
▶️NY city
▶️The World
That I've 👀at so far.

50% marks the median age, e.g.
🇮🇹 47
🏴󠁧󠁢󠁥󠁮󠁧󠁿🏴󠁧󠁢󠁷󠁬󠁳󠁿41
🌍30
🇳🇬18

So expecting similar deaths overall is silly.

2/9 Image
So how have deaths actually played out?

Here are the props. by age to late Dec for places with detailed data.

Looks like NYC, 🇧🇷 & 🇵🇪 have seen far more in the young.

Now these all have younger pops. so is spread the same? Are diff just down to demographics?

3/9 Image
Read 10 tweets
11 Jan
Trend to Mar was dashed blue in🥇📈, since accruing 75k excess deaths.

But, as🥈📊from bit.ly/3nCSOsh covers, accelerated deaths will've been missed in🥇🌊, and accrued deaths will be lowering nonC19 ones now.

So how many were accelerated if this an underestimate?

1/7
With testing now⏫the compounding effect we missed in🥇🌊is much clearer in the🥈.

NonC19 (orange) are dropping as wks progress, likely due to many of🥈🌊deaths only accelerating expected ones by a few wks.

This likely happened🥇🌊, but⏬testing meant we couldn't track it.

2/7
Looking at these excess to trend deaths, we had 13k nonC19🥇🌊.

Sure, some LD induced, but🥈🌊has none? So likely many were untested C19.

It's what happens to cum. nonC19 excess next that's crucial, dropping 15.5k suggests at least this many C19 deaths have reverted since.

3/7
Read 7 tweets

Did Thread Reader help you today?

Support us! We are indie developers!


This site is made by just two indie developers on a laptop doing marketing, support and development! Read more about the story.

Become a Premium Member ($3/month or $30/year) and get exclusive features!

Become Premium

Too expensive? Make a small donation by buying us coffee ($5) or help with server cost ($10)

Donate via Paypal Become our Patreon

Thank you for your support!

Follow Us on Twitter!

:(