
Inside Bar 📚
▪️ What it is?
▪️ Why is it so powerful?
▪️ How to use it?
▪️ Fakeouts?
▪️ Which Timeframe to use?
1/14
▪️ What it is?
▪️ Why is it so powerful?
▪️ How to use it?
▪️ Fakeouts?
▪️ Which Timeframe to use?
1/14

▪️ What it is
An Inside Bar is a simple 1 Bar candle that is hidden inside of the previous OHLC candle
There are two types:
▫️ Inside body & outside wicks
▫️ Inside body & inside wicks
If you are not familiar with what OHLC means read here:
2/14
An Inside Bar is a simple 1 Bar candle that is hidden inside of the previous OHLC candle
There are two types:
▫️ Inside body & outside wicks
▫️ Inside body & inside wicks
If you are not familiar with what OHLC means read here:
https://twitter.com/jackis_trader/status/1284487087505506306
2/14

▫️ Inside body & outside wicks
The body of the candle closes inside of the previous body candle but wicks below
- Weaker of the two
3/14
The body of the candle closes inside of the previous body candle but wicks below
- Weaker of the two
3/14

▫️ Inside body & inside wicks
Both, the body & the wick of the candle close inside of the previous candle between the High & Low
- Stronger of the two
4/14
Both, the body & the wick of the candle close inside of the previous candle between the High & Low
- Stronger of the two
4/14

▪️ Why is it so powerful?
Inside Bar is nothing much different than a compression range on a higher timeframe.
If you zoom in you gonna see a nice long consolidation taking place
The inside bar helps us to establish where the range is broken.
5/14
Inside Bar is nothing much different than a compression range on a higher timeframe.
If you zoom in you gonna see a nice long consolidation taking place
The inside bar helps us to establish where the range is broken.
5/14

And just like with any consolidation, when it finally breaks, expansion is next, usually followed by a violent break
The inside bar can help us see when the range is coming to the end and a new trend is about to get established early on.
6/14
The inside bar can help us see when the range is coming to the end and a new trend is about to get established early on.
6/14

▪️ How to use it?
The best application is when you align it with strong support, then try to spot the inside bar.
Once it's established you can either
1) Aggressive - Put a buy once Inside Bars forms
2) Conservative - Buy on a confirmed break out of the Inside Bar High
7/14
The best application is when you align it with strong support, then try to spot the inside bar.
Once it's established you can either
1) Aggressive - Put a buy once Inside Bars forms
2) Conservative - Buy on a confirmed break out of the Inside Bar High
7/14

The other way is in an already established trend.
Price runs big but needs to pause for a few days or weeks to then continue its run.
We call this "Re-accumulation"
A great place to buy or add to your already existing position
8/14
Price runs big but needs to pause for a few days or weeks to then continue its run.
We call this "Re-accumulation"
A great place to buy or add to your already existing position
8/14

A nice example of a short/sell of an Inside Bar
1) Price broke an old significant high and started to consolidate below.
2) Formed an Inside Bar
3) Broke down significantly afterwards
9/14
1) Price broke an old significant high and started to consolidate below.
2) Formed an Inside Bar
3) Broke down significantly afterwards
9/14

▪️ Fakeouts?
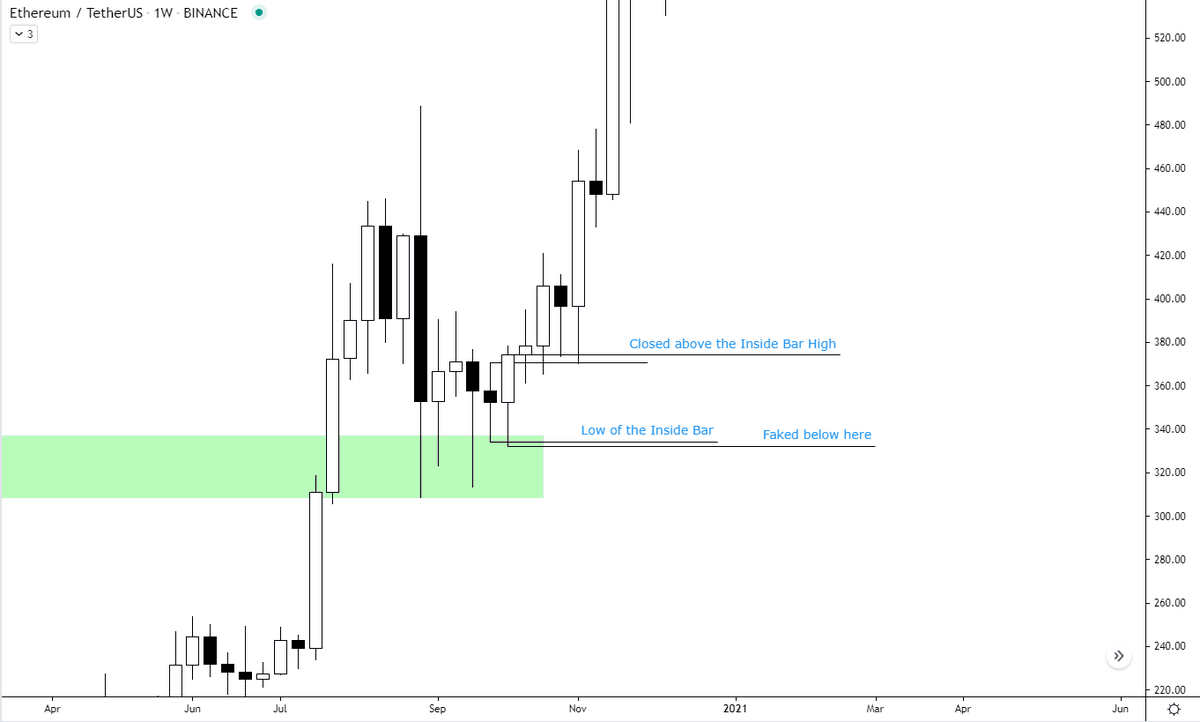
Sometimes, when we spot the Inside Bar we can see price breaks on the opposite side which many could see as a bearish break but i's important to remember we are at HTF support
This is where we must wait for the candle to close to indicate the true intentions
10/14
Sometimes, when we spot the Inside Bar we can see price breaks on the opposite side which many could see as a bearish break but i's important to remember we are at HTF support
This is where we must wait for the candle to close to indicate the true intentions
10/14

In this case, we can clearly see the move below was a clear manipulation and the candle proceeded to break the Inside Bar High later on in the week.
Establishing a new strong uptrend.
11/14
Establishing a new strong uptrend.
11/14
Currently, we are seeing the same thing happening in the #Bitcoin price & only time will tell if this is about to happen again.
Either way, it adds up to the probabilities
12/14
Either way, it adds up to the probabilities
12/14

▪️ Which Timeframe to use?
The best timeframes for Inside Bars are:
1) Monthly
2) Weekly
3) Daily
13/14
The best timeframes for Inside Bars are:
1) Monthly
2) Weekly
3) Daily
13/14
In the end, I would like to add that as with everything this is not a holy grail but another great real-time tool to use to spot the future markets moves and add to your probabilities
If you have found this thread valuable please like & share it with your friends.
14/14
If you have found this thread valuable please like & share it with your friends.
14/14
• • •
Missing some Tweet in this thread? You can try to
force a refresh


