
Why and how 90% of retail traders lose and how you can join the 10% that win. This is by far the most important thread I've made. I truly hope this helps change your lives.
The contents of this thread will go against almost all conventional trading rules/strategies you may have learned through books and videos, but I'm incredibly confident this is how @MrZackMorris and other great traders trade
The concept is simply Supply and Demand. When stocks consolidate in a range, there is an agreement in price and institutional orders are being filled. When it deviates from that range (impulsive), big money orders are left unfilled until the stock reaches that area again
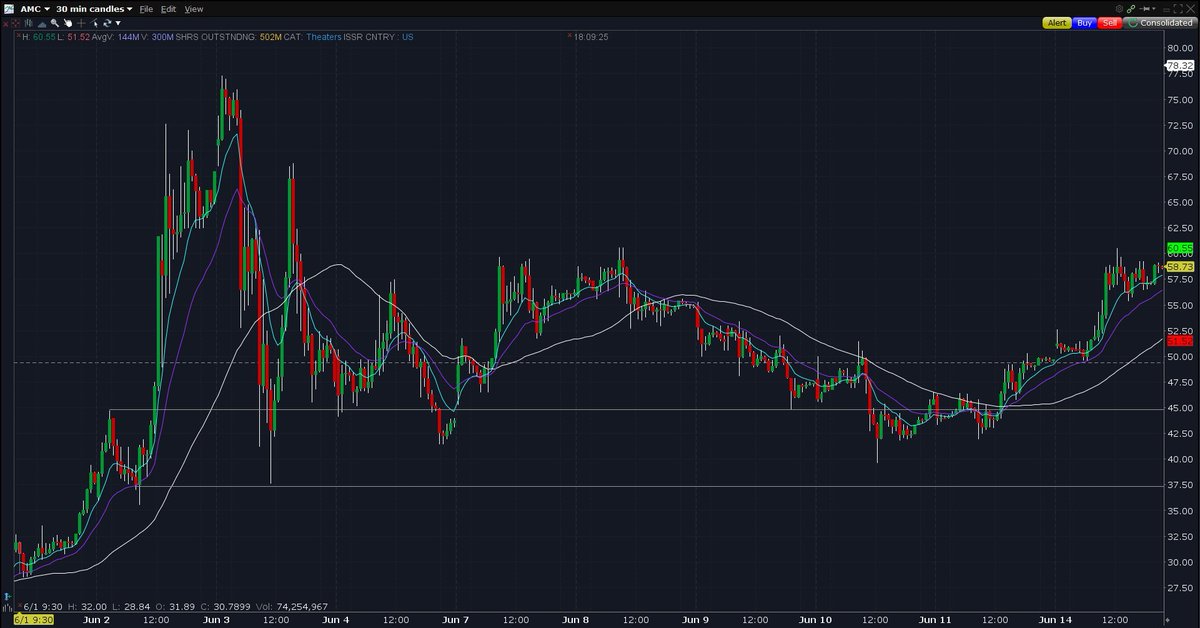
$AMC
$AMC

Because the stock rose up, there were unfilled buy orders, creating what's called a Demand Zone. This causes an imbalance. Institutions don't chase and that's how they make the real money. They'll let their orders sit there for hours, days, weeks, etc. until they're filled.
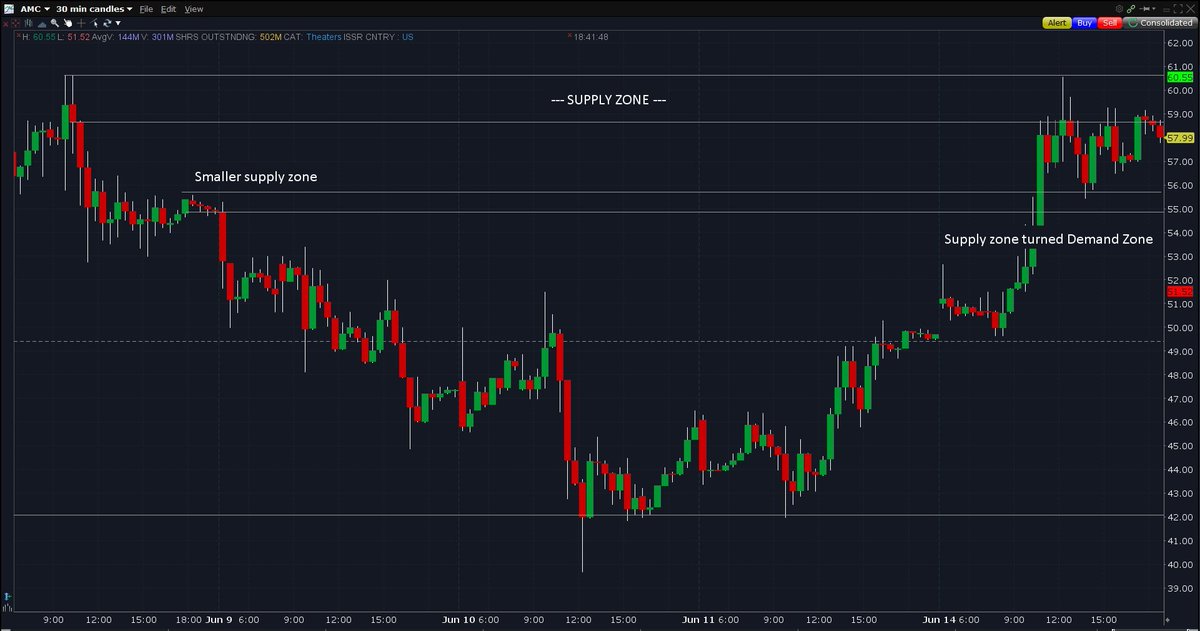
Look at $AMC. When the price drops back into the demand zone, those leftover institutional orders are filled, and from there, the price reverses back up. Tutes selling on the way down also know to stop shorting/selling because it's entering that demand zone

What happens is that your indicators will tell you it's bearish and not to buy down there when it's dipping and to wait for "confirmation of strength" and a "reversal" before adding. It's very tough going against this logic engrained in us, so you need to reprogram yourself.
You can have confirmation, which may make you feel better and capture bits of the move, or you can have a low risk, high reward entry, but you can't have both. $AMC Example of how all indicators lag and indicate bearish where you really should be adding (demand zone):
The blue is the 9 EMA, purple is the 20 EMA and the white is the 50 SMA. All indicate bearish, yet look where the price really reversed - In that demand zone.
I think @_SharkTrader says it very well here
https://twitter.com/_SharkTrader/status/1390525492701405187?s=20
On the opposite end, you have SUPPLY zones. This is where big institutional sell orders are left unfilled. Once the price reaches that area, the vice versa of what I explained for demand zones happens. Tutes sells are filled and buyers slow down.

Everything in between the bigger supply and demand zone is the smaller institutional buy/sells zones. Where retail loses money is adding in between. By the time the stock hits your scanner as up-trending, you're most likely buying into a supply zone (tute selling into you).

At this point, you'll panic sell, average down, and eventually take a loss.
A single support and resistance line level is the most common conventional trading system, yet is also the most flawed one because it gives you one specific value to adhere to. You think if it breaks or holds that magic number, that's confirmation, but it's not.
One thing similar to S/R is that supply zones can become demand zones and demand zones can become supply. $AMC example again. Once tute sell orders in a supply zone are filled, the stock can push through it on volume and then it'll become a demand zone to bounce from afterward
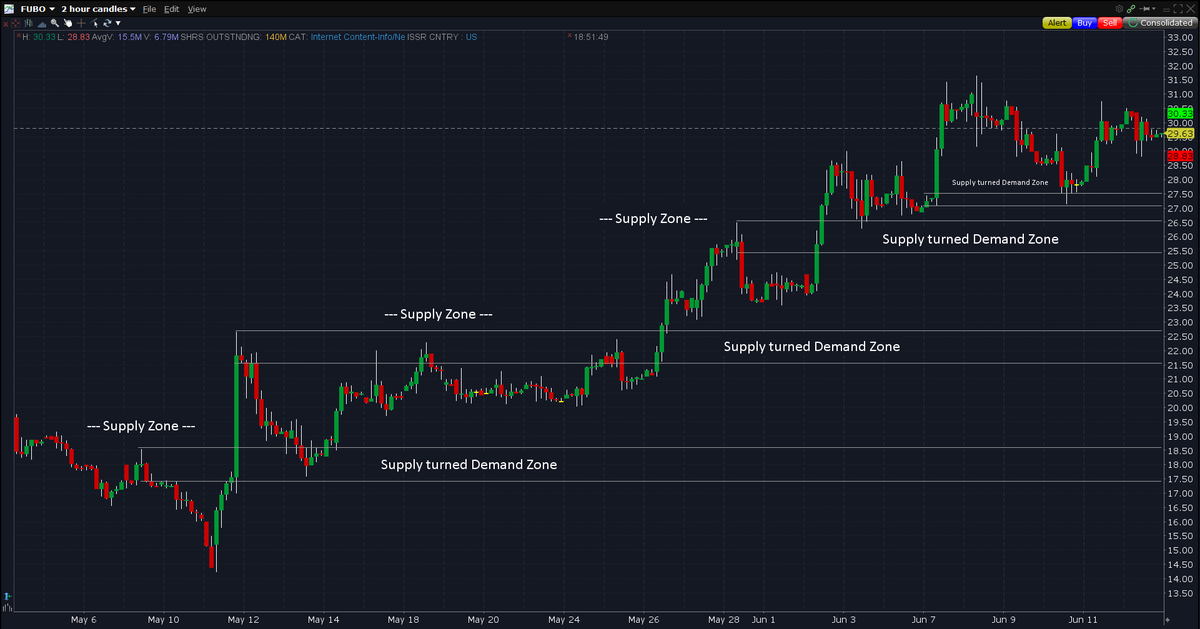
$FUBO perfect example of supply zones turning demand zones and the stock bouncing every time because those institutional orders are sitting there unfilled until filled
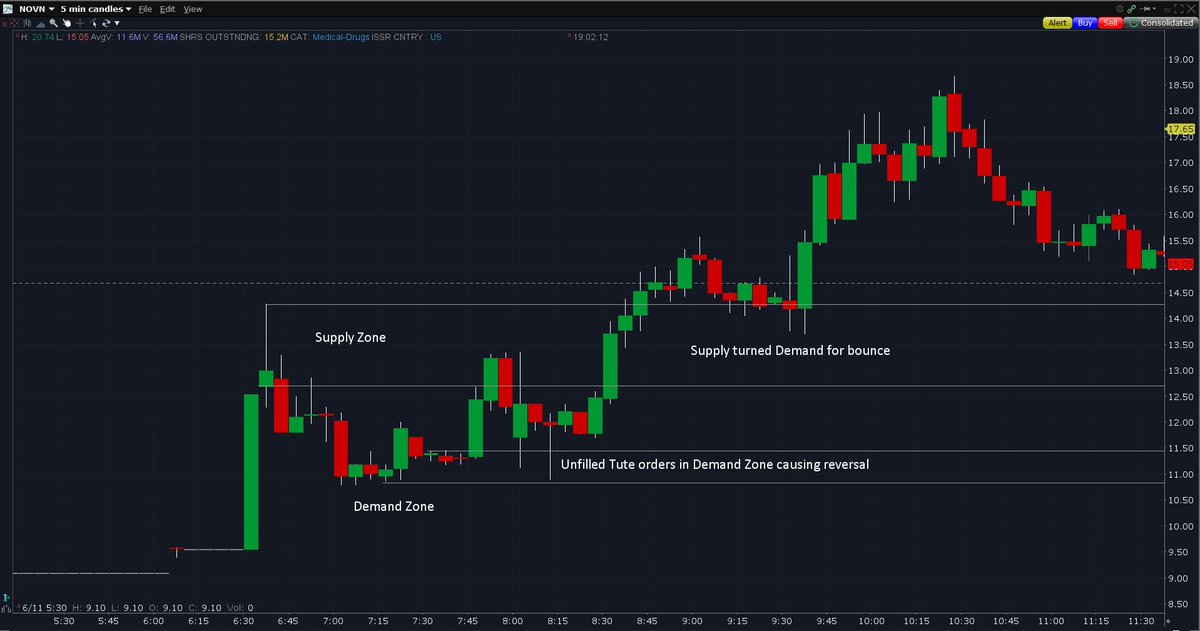
$NOVN example. I added this at 13.70s at 9:35 while it was flushing. It went against all indicators and common logic to not buy something not showing strength, but you have to ignore that and follow the smart money, aka, tutes. They add in the demand zones and so should you.
When I learned about supply and demand, I went and checked through every trade I made (even up to last year) and the concept always worked. Do the same and I guarantee you'll notice the glass ceiling preventing you from being a great trader crack
When @MrZackMorris says buy the ugly or opening flush, he doesn't mean blindly buy it. It's a calculated buy. If a stock has real volume and gaps up, tutes want in. 9:30 profit takers and tutes flush it, causing it to hit a demand zone for unfilled tute orders to fill and reverse
I've crosschecked this with tons of great traders and any time they've called an add on a stock, it's always been in a demand zone. @MrZackMorris does this, @FapyTrades does this, and even @ripster47.
@MrZackMorris scalped $CLOV the other day and @ripster47 did too. Look where they both bought: while it was flushing and going into a demand zone. Easy bounce from the demand zone off Tutes unfilled orders from before getting filled.
https://twitter.com/ripster47/status/1402660696257486853?s=20
Even @Brady_Atlas volume profiles follow similar logic. The area showing the most volume is where the most consolidation was done and deviation from there + little volume in other areas is an indication of unfilled orders. That's the area the stock will bounce or reject from.
Similar logic applies to swing trading. Look for supply and demand zones. It's why Tutes force articles out to drop a stock price so their orders in demand zones get filled before the real runs occur. Aka, accumulating the cheap shares when retail panics off news.
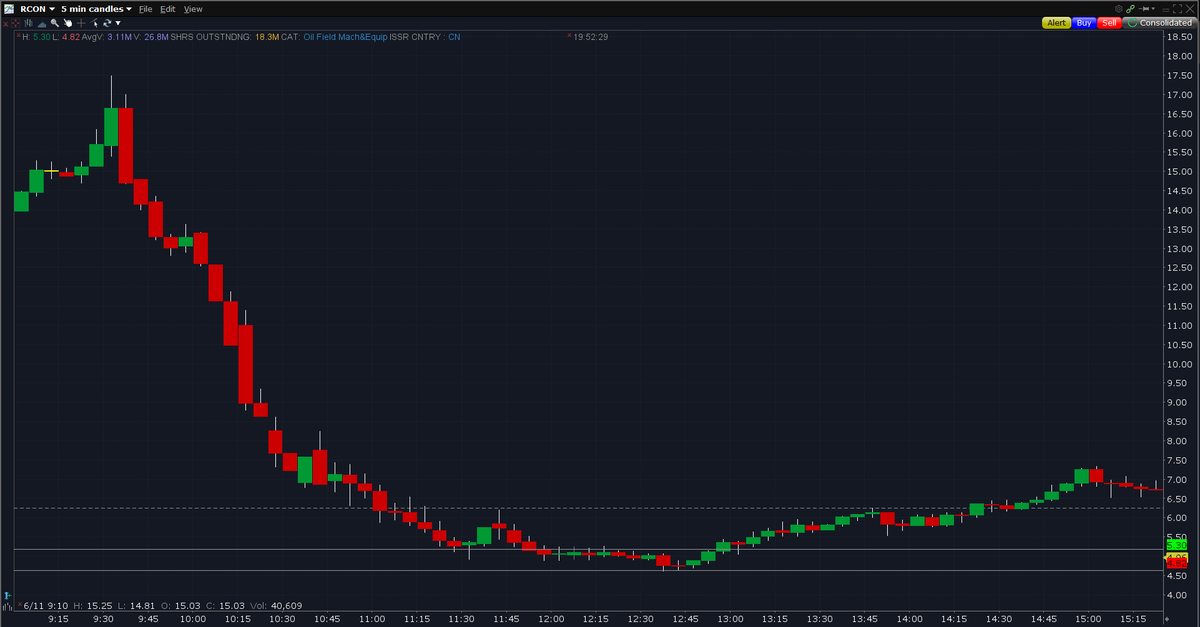
Check this $RCON example. The daily demand zone from a while back was where the price stopped and began curling. Why? Unfilled institutional orders were still there. They can play the long waiting game. You need to stop with the FOMO and wait too.

@Givvy_Stocks has an awesome pinned thread with videos from Sam Seiden on how to identify and draw supply and demand zones, how tutes think, where price will reverse, etc. Do check it out. It will change your game.
https://twitter.com/Givvy_Stocks/status/1394016272619290624?s=20
That's a wrap. I hope this helps. When you can identify these zones and have the patience to wait for your orders to fill, there's no reason you can't increase your account in huge proportion every day. The secret is out & the losing ends here. May you all prosper from hereon out
Hit us up in MTA. We just want you to be self-sufficient discord.gg/MTA
A way I spot and confirm actual supply and demand zones after I've drawn them is to look at the individual volume on candles when they enter into a zone. You'll notice the volume on the candles will be much greater.

Level 2 won't really help much with identifying the big zones because the tute orders are hidden, but you can see a bit of the order flow on the time and sales. Look for huge lots on the tape.
Lots of consolidation in a channel means the zone is undecided. Stay away from that. Let it make the impulsive move up or down first before you slap a position. Let it tell you whether it's a supply or demand zone
I love this video by Sam Seiden and Carmine Rosato on YouTube also has great stuff.
@threader_app unroll
For time frames, it depends on what I can see on the chart. Some time frames have huge zones and the risk is too big, so I'll shorten it for smaller zones. It also depends on the float, volume, etc. $AMC would require big frames. On other stocks, I like the 5-10 mins
• • •
Missing some Tweet in this thread? You can try to
force a refresh


