Apologies upfront for the complexity of this post today, but the delaying of the 'emergency' meeting regarding myocarditis in younger individuals is beyond shocking and irresponsible.
In this post I have attached my commentary directly to each of these images, please read each and consider them carefully.
This article details cases of myocarditis in younger men, in particular, following mRNA accines. Note the relative specificity of timing - usually within 4 days after the second dose.
Note the very high rate for individuals between 16-30 years of age.
Also note the date - 4/27/21
Note the very high rate for individuals between 16-30 years of age.
Also note the date - 4/27/21

Chart showing myocarditis cases reported as of 5/31/21 compared to a 'background' rate.
Again, we see an elevation in the younger age groupings.
Again, we see an elevation in the younger age groupings.

However, note some of the details here. There is some odd data parsing occurring that deserves inspection. We have 12-15 (4 years), 16-17 (2 years), 18-24 (7 years), 25-39 (15 years), 40-49 (10 years) 50-64 (15 years).
What an absolutely BIZARRE breakdown of age groupings. Whenever one sees inconsistencies like this, there should be attention paid as to WHY. If the purpose is illumination, we want to minimize variables as much as possible, not complicate things further like they have here.
We also know that according to the Israeli data that the most affected group were those from 16-30, and indeed there is a strong signal between 16 and 24 years. But note the next age grouping up. It goes from 25-39 years.
Why is this age grouping a full 15 years long? We can see in the chart that this group has higher reports than the older cohorts, but still within their 'background' rate.
But what would happen if we parsed it out differently? What if we parsed out 25-30 years old as the Israelis noted? Would that age group also show elevation over 'background'?
And speaking of that 'background rate' - recall from the first article that noted the time dependency - with most cases occurring within 4 days of the second dose. Awfully narrow and specific time scope.
But look down at the fine print at the bottom of this chart. For some reason, those presenting this data chose to consider a 31-day post-accination window for their background.
If most cases are occurring within 4 days, then the other 27 days will be closer to the background rate. By counting background for 31 days, the authors are attenuating the signal again, by potentially 8x. How front loaded is it?
We don't know because this is how they have decided to parse it for us, but many sources have noted the narrow window of occurrence.
Whenever one is evaluating data like this and sees several inexplicable decisions like we see here, red flags should go up.
Whenever one is evaluating data like this and sees several inexplicable decisions like we see here, red flags should go up.
Even with the odd parsing decisions we still see significant elevations in the younger cohorts - those least affected by the disease itself.
Chart from pg. 18 at fda.gov/media/150054/d…
Chart from pg. 18 at fda.gov/media/150054/d…
News reports these days have been minimizing the potential issues associated with myocarditis post-accination, frequently noting that cases are 'mild' or individuals may only stay a 'few days' in the hospital before returning home.
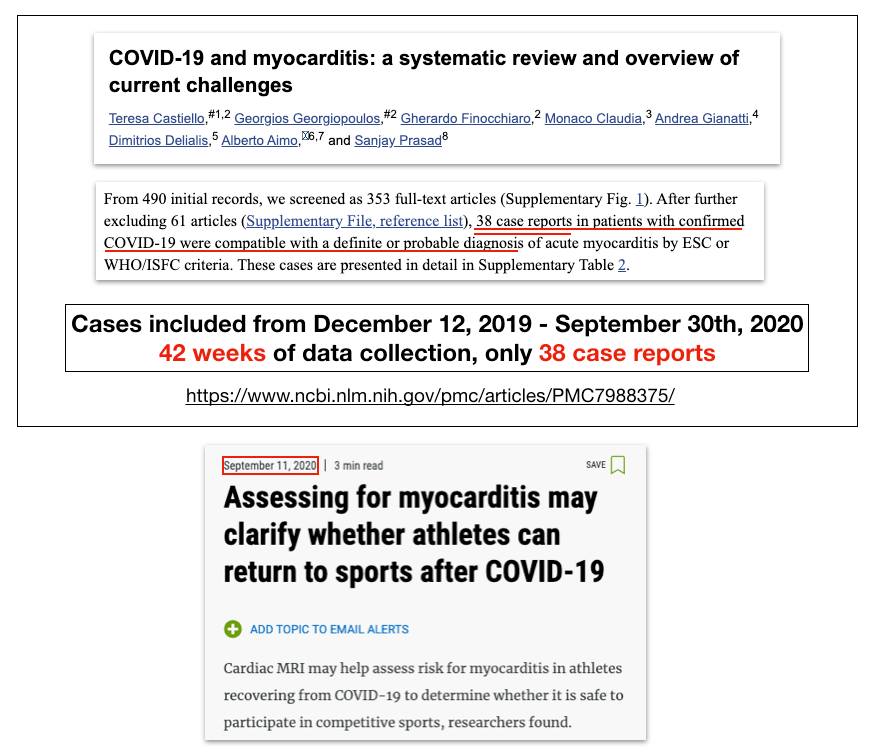
But that wasn't always the case. Last year we were all being terrorized with cases of myocarditis occurring in young people post-COVID infection. So heavy was the fear-mongering that student athletes were made to undergo post-infection MRIs in order to return to their sports.
But how prevalent were these post-COVID cases of myocarditis? A review study found only 38 case reports with definite or *probable* diagnosis of myocarditis over 42 full weeks of the pandemic.
Finally, a comparison between the rates of post-accination TTS that caused the pause for J&J and caution for younger women considering it comes out to a rate of ~7 per million doses.

As we have repeatedly established, myocarditis is strongly age dependent, so averaging the total number of cases over ALL jabs given will, again, attenuate the signal.
But if we limit to just 16-24 year olds as of May 31st, we can see in the chart that we are looking at 35 cases/million in the 16-17 year olds and 20.6/million for 18-24 year olds.
Some of that rate will, of course, be part of the background rate, but as previously discussed, that 'background' is likely significantly inflated.
#InThisTogetherOhio
#InThisTogetherOhio
• • •
Missing some Tweet in this thread? You can try to
force a refresh