22/
#Bitcoin
What a fun 3 days. If you enjoy Rollercoasters you're in the right place.
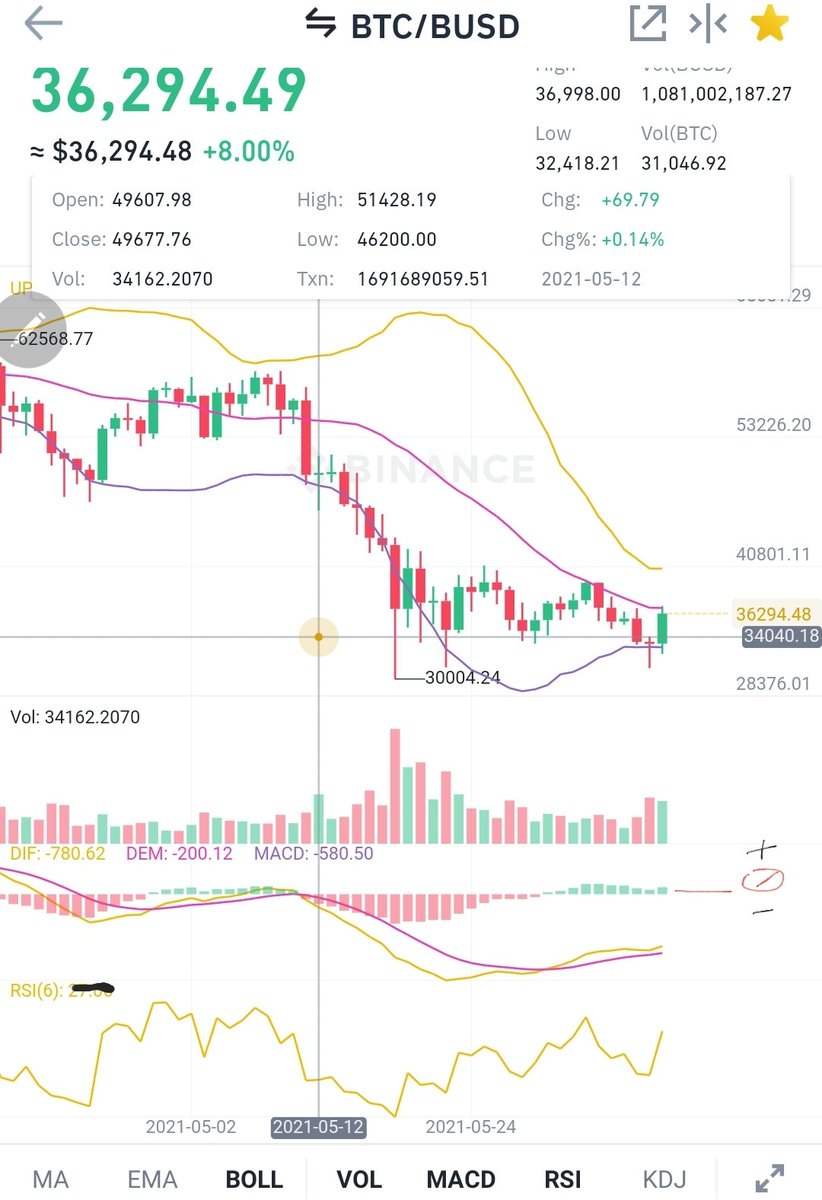
About that bad news: all the signals lined up and you saw the expected. The Histogram turned red & the MACD crossed;below the 0 line. This pushed the price to the next Support level of $28.8K
#Bitcoin
What a fun 3 days. If you enjoy Rollercoasters you're in the right place.
About that bad news: all the signals lined up and you saw the expected. The Histogram turned red & the MACD crossed;below the 0 line. This pushed the price to the next Support level of $28.8K

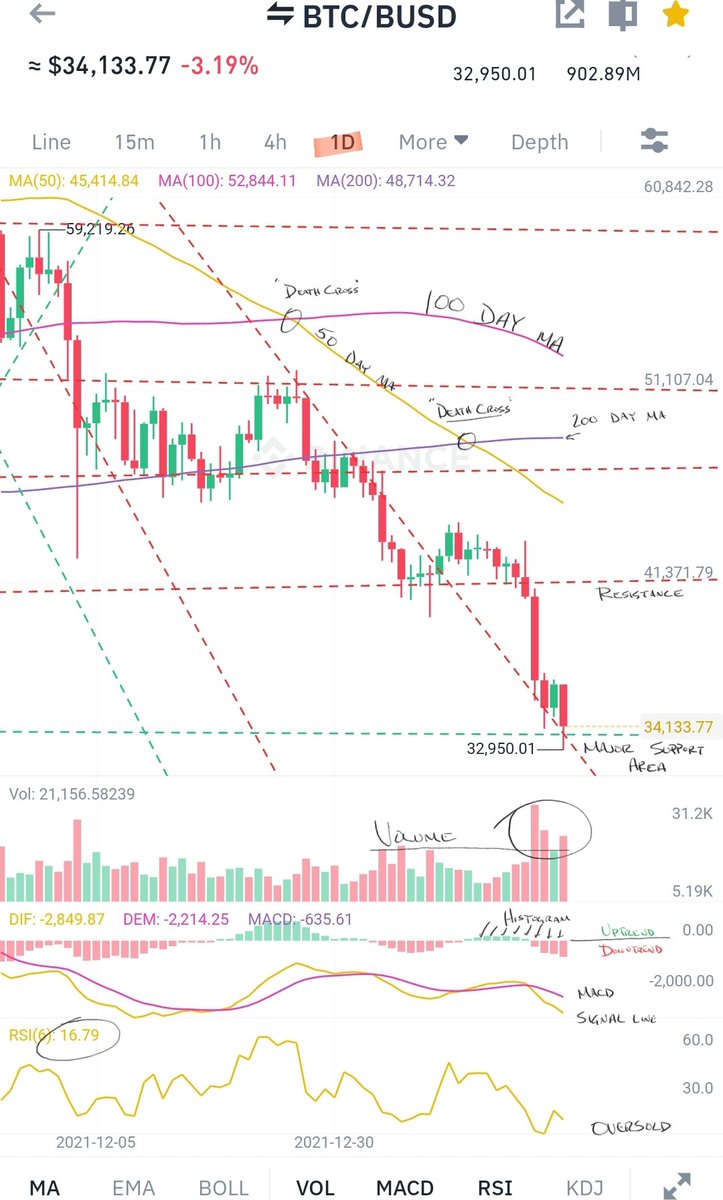
23/
Major Support turned into Resistance and price even fell to the next Support for 1 day but this is how the Market will fake you out. Shorts are not in-the-money (ITM) and neither are those who opened up Put Options.
Major Support turned into Resistance and price even fell to the next Support for 1 day but this is how the Market will fake you out. Shorts are not in-the-money (ITM) and neither are those who opened up Put Options.

24/
Now what?
You still are looking for the things mentioned in 20/ to happen as well as a Daily close above Major Support of $34K. You are also watching for yet another potential "Fakeout" as the MACD/Signal line looks to cross back over one another.
Now what?
You still are looking for the things mentioned in 20/ to happen as well as a Daily close above Major Support of $34K. You are also watching for yet another potential "Fakeout" as the MACD/Signal line looks to cross back over one another.

25/
About that 'Fakeout.'
As highly anticipated you saw over the past few days yet another Fakeout. Nonetheless, the MACD/ Signal line crossed and as expected you saw a price surge as well as a positive Histogram. We are still awaiting both lines to cross over the 0 line.
About that 'Fakeout.'
As highly anticipated you saw over the past few days yet another Fakeout. Nonetheless, the MACD/ Signal line crossed and as expected you saw a price surge as well as a positive Histogram. We are still awaiting both lines to cross over the 0 line.

26/
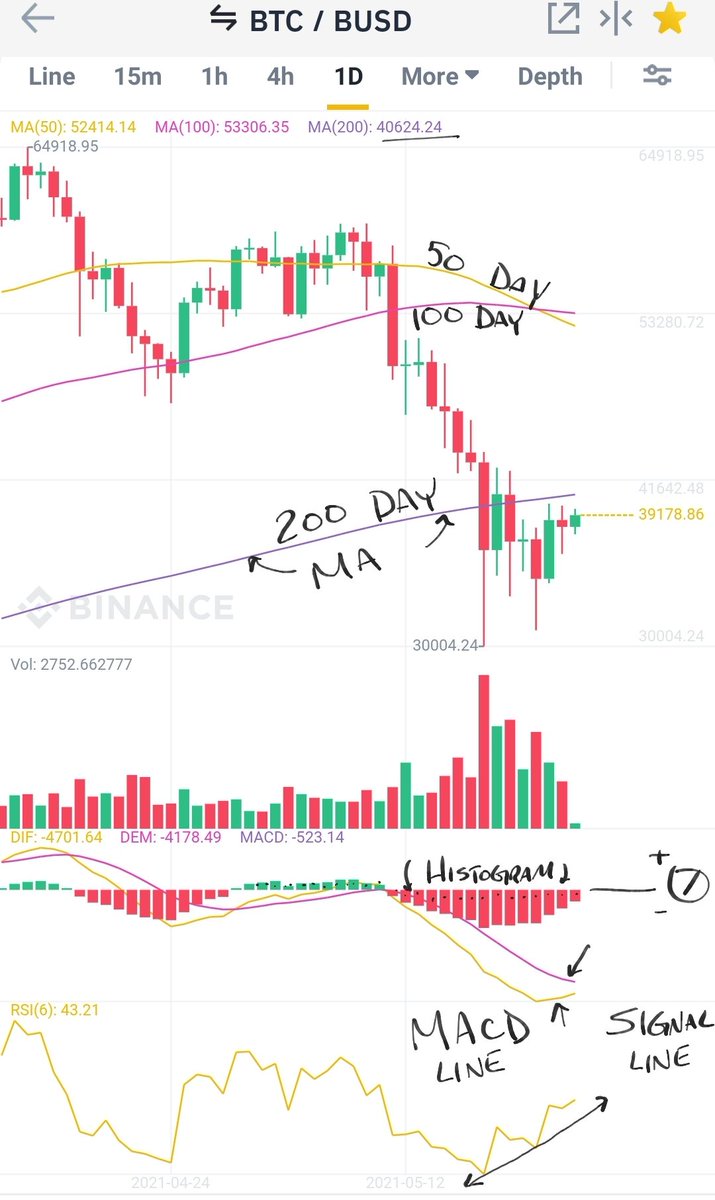
The Overall trend is depicted by this 0 line depending on the timeframe you're looking at.
The Bbands or Bollinger Bands are a crucial element of Technical Analysis. You can expect prices to trade in between these Bands when the trend in sideways until a Breakout.
The Overall trend is depicted by this 0 line depending on the timeframe you're looking at.
The Bbands or Bollinger Bands are a crucial element of Technical Analysis. You can expect prices to trade in between these Bands when the trend in sideways until a Breakout.

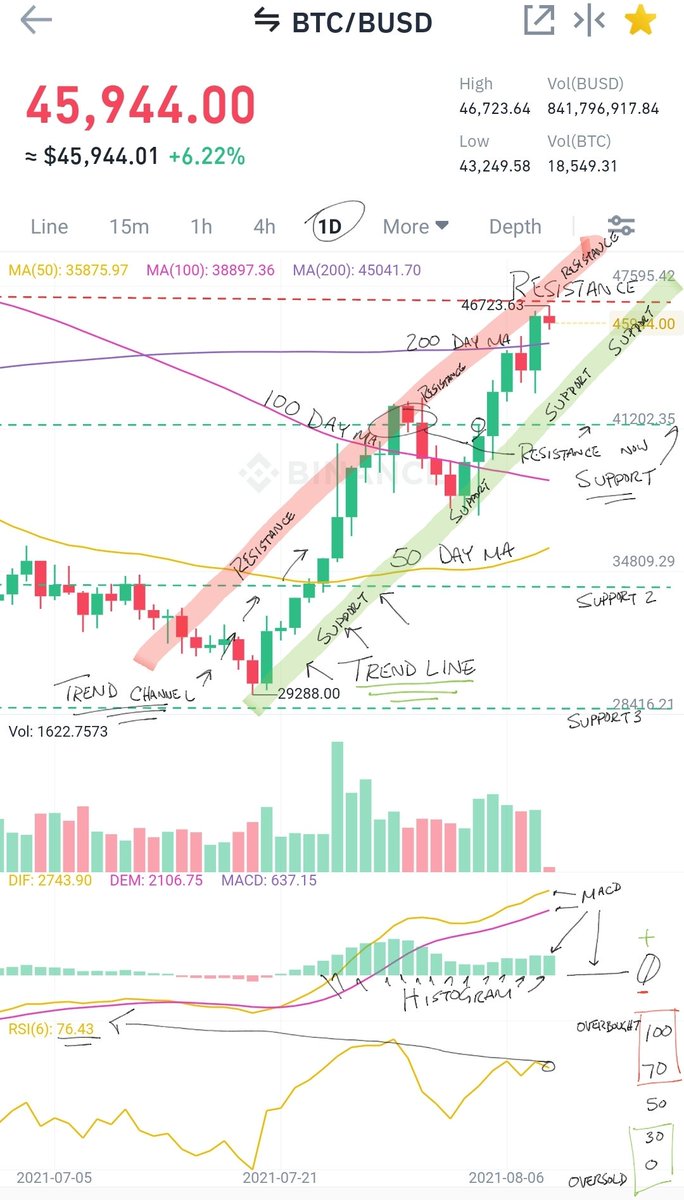
27/
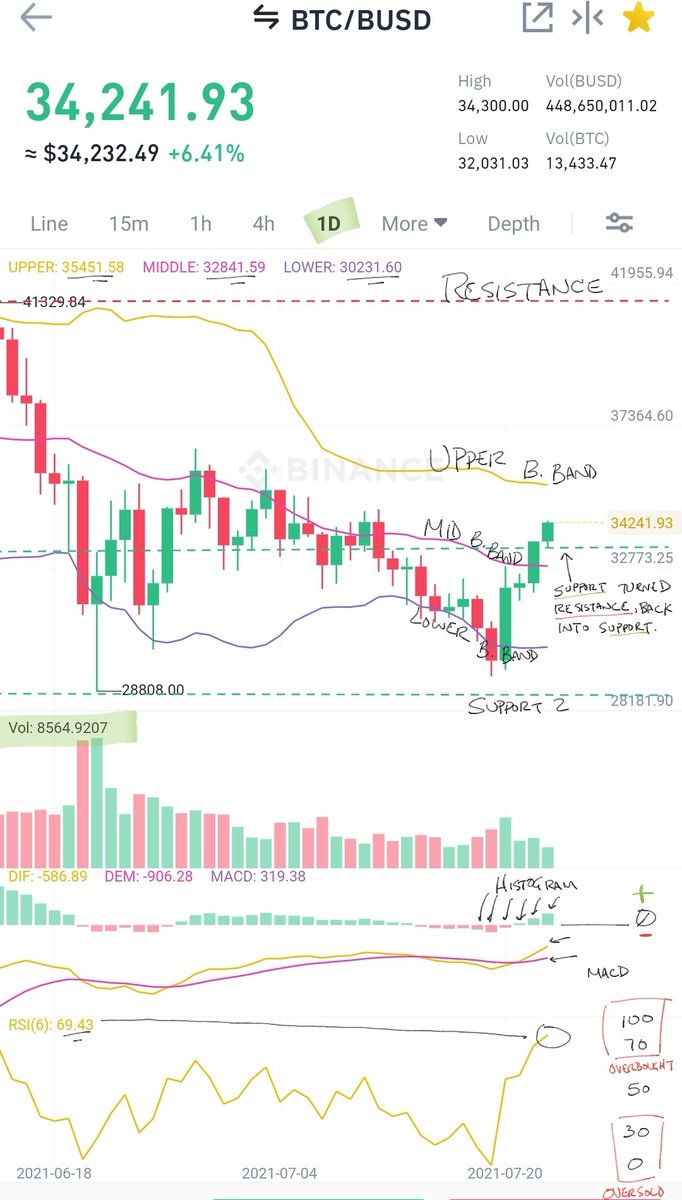
These Bollinger Bands will generally represent Support & Resistance. As you can see the price traded between the MID & Lower Bband for 12 days. If price can *Close above the MID Bband you can expect to see it rise to the Upper Band and possibly break through it.
These Bollinger Bands will generally represent Support & Resistance. As you can see the price traded between the MID & Lower Bband for 12 days. If price can *Close above the MID Bband you can expect to see it rise to the Upper Band and possibly break through it.

28/
The only bad news is that the MACD is below the 0 line and the Relative Strength Index (RSI) pushing 70. Other than that, all signals look Bullish including the Volume over the past few days, the increasing RSI, and Support levels holding up.
The only bad news is that the MACD is below the 0 line and the Relative Strength Index (RSI) pushing 70. Other than that, all signals look Bullish including the Volume over the past few days, the increasing RSI, and Support levels holding up.

#Bitcoin
29/
When the overall trend (for that timeframe) is down you'll see the Bears winning certain battles more than the Bulls at important milestones in Technical Analysis. You'll always see upticks in downtrends and downticks in uptrends. The 0 line is very important.
29/
When the overall trend (for that timeframe) is down you'll see the Bears winning certain battles more than the Bulls at important milestones in Technical Analysis. You'll always see upticks in downtrends and downticks in uptrends. The 0 line is very important.

30/
As the RSI becomes closer to 70, Overbought levels, a reversal to Oversold usually follows. No matter the trend.
We are now in Day 18 of that sideways price action between the MID & Lower Bbands as mentioned in 27/. We didn't quite see that breakout/*closing price above it.
As the RSI becomes closer to 70, Overbought levels, a reversal to Oversold usually follows. No matter the trend.
We are now in Day 18 of that sideways price action between the MID & Lower Bbands as mentioned in 27/. We didn't quite see that breakout/*closing price above it.

31/
What you should be watching:
•Bulls & Bears fight (again) at Support of $34K.
•Price action within the Bbands.
•The 100 & 200 Day Moving Average interact over the next few days.
•MACD
•RSI
What you should be watching:
•Bulls & Bears fight (again) at Support of $34K.
•Price action within the Bbands.
•The 100 & 200 Day Moving Average interact over the next few days.
•MACD
•RSI


32/
#Bitcoin
Day 28 of that sideways price action between the MID & LOWER B.BANDS. We still are awaiting a breakout either way for confirmation of the next price channel.
Since 7/5 we have seen prices go from oversold to not so much overbought. This can be a bullish sentiment.
#Bitcoin
Day 28 of that sideways price action between the MID & LOWER B.BANDS. We still are awaiting a breakout either way for confirmation of the next price channel.
Since 7/5 we have seen prices go from oversold to not so much overbought. This can be a bullish sentiment.

33/
Since 7/5:
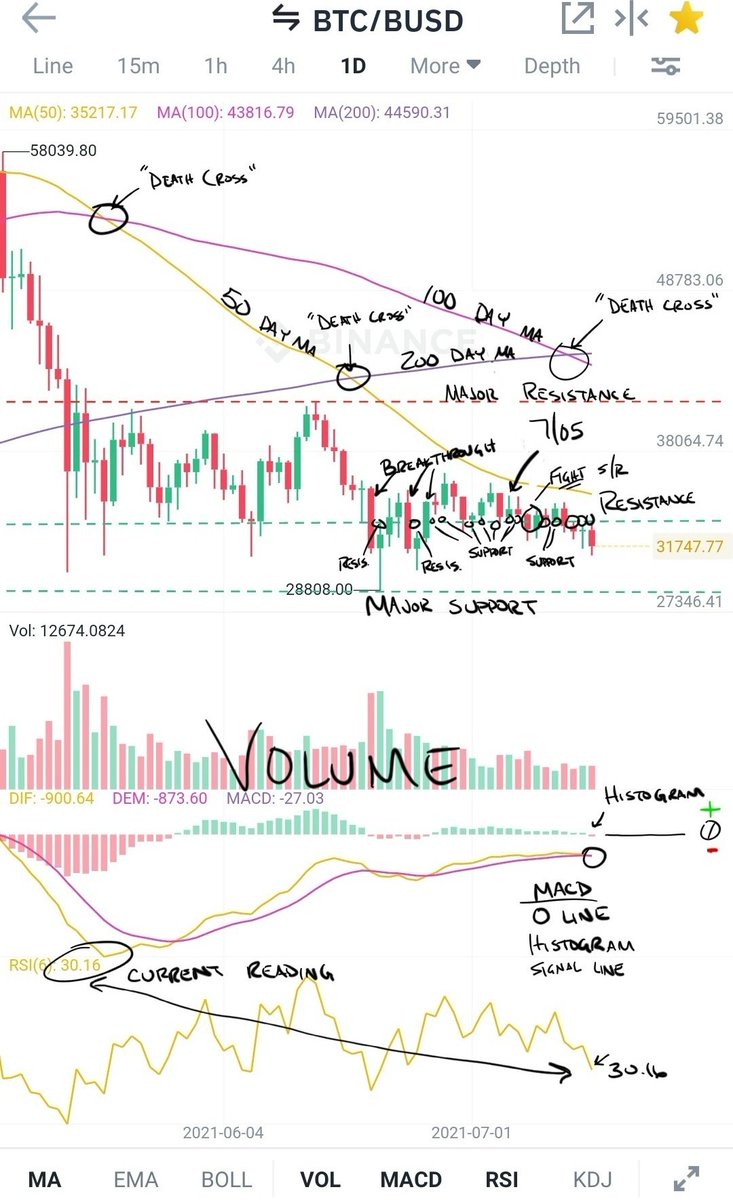
✔ You have seen the Bulls & Bears fight time and time at Support (now temporary Resistance) at $34K. This is an important level to watch.
✔ You also saw the "Death Cross" or the lower Moving Average(MA) cross below the higher MA (100Day MA crossed the 200Day MA)
Since 7/5:
✔ You have seen the Bulls & Bears fight time and time at Support (now temporary Resistance) at $34K. This is an important level to watch.
✔ You also saw the "Death Cross" or the lower Moving Average(MA) cross below the higher MA (100Day MA crossed the 200Day MA)

34/
The MACD is still below the 0 line which is Bearish on a Daily timeframe and it doesn't help that the MACD/Signal line have crossed one another. The overall Daily trend is Bearish until the MACD lines are both above the centerline. Eventually they will both cross over.
The MACD is still below the 0 line which is Bearish on a Daily timeframe and it doesn't help that the MACD/Signal line have crossed one another. The overall Daily trend is Bearish until the MACD lines are both above the centerline. Eventually they will both cross over.

35/
The RSI is currently at 30.16 and it is Oversold. It could reach levels in the 20's; even 'teens.'
Bulls are trying to fight to keep price above $34K Support while the Bears are trying to turn this Support into Resistance.
Over the next month: The Golden Crosses
The RSI is currently at 30.16 and it is Oversold. It could reach levels in the 20's; even 'teens.'
Bulls are trying to fight to keep price above $34K Support while the Bears are trying to turn this Support into Resistance.
Over the next month: The Golden Crosses
36/
Day 33 has ended/started with a Breakout below the Lower Bollinger Bands. This is in line with the overall bearish daily trend. Eventually you'll see price action do the opposite at the Upper Bollinger Bands. Price action always trades in between the bands. Upper Band=$35.8k
Day 33 has ended/started with a Breakout below the Lower Bollinger Bands. This is in line with the overall bearish daily trend. Eventually you'll see price action do the opposite at the Upper Bollinger Bands. Price action always trades in between the bands. Upper Band=$35.8k

37/
As mentioned in thread 34/ the MACD crossing below the signal line is Bearish. The 0 line is what separates the trend on any given timeframe. The MACD lines were above the 0 line(Daily) since Oct 2020 until April 2021. It has been a few months below it.
*See Weekly Chart
As mentioned in thread 34/ the MACD crossing below the signal line is Bearish. The 0 line is what separates the trend on any given timeframe. The MACD lines were above the 0 line(Daily) since Oct 2020 until April 2021. It has been a few months below it.
*See Weekly Chart

38/
As mentioned in 35/ you saw the RSI reach levels in the 20' now teens. The current reading is Oversold at 19.38. You will likely see a reversal soon as levels bounce from oversold to overbought.
The Bears have won the last few battles of turning Support into Resistance.
As mentioned in 35/ you saw the RSI reach levels in the 20' now teens. The current reading is Oversold at 19.38. You will likely see a reversal soon as levels bounce from oversold to overbought.
The Bears have won the last few battles of turning Support into Resistance.

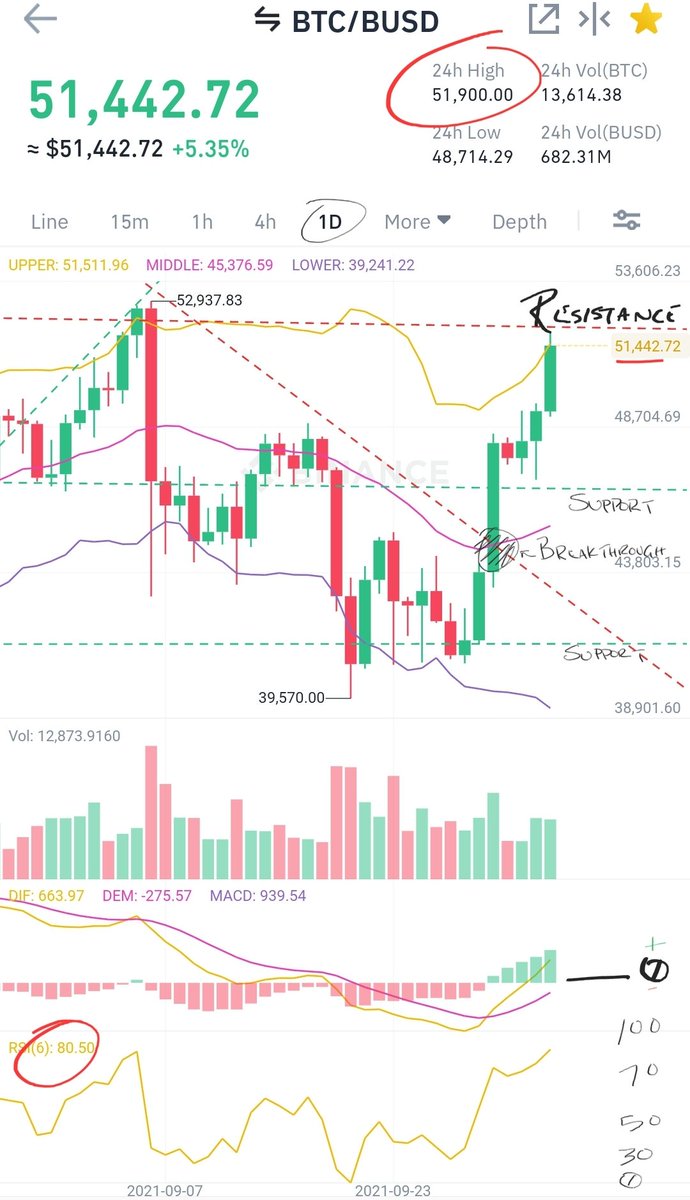
39/
The 'Death Cross' pushed price from $34K (Support) to the current price which is near the next Support of $28.8K. Once price has broken Support it becomes Resistance. $34K brings a major battle between the Bulls & Bears. Connecting the High's & Low's you can see the channel.
The 'Death Cross' pushed price from $34K (Support) to the current price which is near the next Support of $28.8K. Once price has broken Support it becomes Resistance. $34K brings a major battle between the Bulls & Bears. Connecting the High's & Low's you can see the channel.

40/
As mentioned in 38/ you saw the RSI reach insane oversold levels of 19.38 to a near overbought level within a day and a half. Reversals happen fast. The Bears are losing strength and soon you could see the old Support, now Resistance turn back into Support.
#Bitcoin
As mentioned in 38/ you saw the RSI reach insane oversold levels of 19.38 to a near overbought level within a day and a half. Reversals happen fast. The Bears are losing strength and soon you could see the old Support, now Resistance turn back into Support.
#Bitcoin

41/
As mentioned in 36/ you saw the price action go from the Lower Bollinger Bands to the Upper Bollinger Bands in just a few days. Again, price action will always trade in between these bands, no matter the breakout. Upper Band = $35.4K.
As mentioned in 36/ you saw the price action go from the Lower Bollinger Bands to the Upper Bollinger Bands in just a few days. Again, price action will always trade in between these bands, no matter the breakout. Upper Band = $35.4K.

42/
As mentioned in 38/ the RSI was Oversold at 19.38 and you saw a reversal. The Bulls have prevailed against the Bears at Resistance, turning it back into Support. A daily closing price above $34K would give confirmation on the Bulls winning this on-going battle.
As mentioned in 38/ the RSI was Oversold at 19.38 and you saw a reversal. The Bulls have prevailed against the Bears at Resistance, turning it back into Support. A daily closing price above $34K would give confirmation on the Bulls winning this on-going battle.
43/
Good news is:
The MACD is getting closer to the 0 line. This is very Bullish and it helps that the Histogram has also turned positive over the last few days.
Price looks to break through the 50 Day Moving Average (MA) after 74 days trading below it.
Good news is:
The MACD is getting closer to the 0 line. This is very Bullish and it helps that the Histogram has also turned positive over the last few days.
Price looks to break through the 50 Day Moving Average (MA) after 74 days trading below it.


44/
As mentioned in 42/ you saw price close above $34K (confirmation) which has been a rough battle between the Bulls & Bears for many weeks. The next Resistance level is at $41K as mentioned in 1/.
Current RSI reads Overbought at 84.93 but you could see the RSI reach the 90's.
As mentioned in 42/ you saw price close above $34K (confirmation) which has been a rough battle between the Bulls & Bears for many weeks. The next Resistance level is at $41K as mentioned in 1/.
Current RSI reads Overbought at 84.93 but you could see the RSI reach the 90's.

45/
The good news in 43/ prevailed and now we are on day 2 of the price being above the 50 Day MA, which happens to be the on going battle price level.
Eventually you'll see price reach and break-through the 100 Day MA (currently Resistance) and then the 200 Day MA.
#Bitcoin
The good news in 43/ prevailed and now we are on day 2 of the price being above the 50 Day MA, which happens to be the on going battle price level.
Eventually you'll see price reach and break-through the 100 Day MA (currently Resistance) and then the 200 Day MA.
#Bitcoin

46/
As mentioned in 44/ you saw price rejected at Resistance, at least for now. Resistance is where the Bears have a strong ceiling. Also as mentioned you saw the RSI reach very high levels. The highest recorded was 88.91, a severe overbought level. Retracements are in order.
As mentioned in 44/ you saw price rejected at Resistance, at least for now. Resistance is where the Bears have a strong ceiling. Also as mentioned you saw the RSI reach very high levels. The highest recorded was 88.91, a severe overbought level. Retracements are in order.

47/
More good news to add to 45/ would be the MACD lines crossing above the 0 line. This is extremely Bullish no matter the retracements. The last time these lines were above the 0 line was in May & April, respectively. The overall Daily trend has changed from Down to Up.
More good news to add to 45/ would be the MACD lines crossing above the 0 line. This is extremely Bullish no matter the retracements. The last time these lines were above the 0 line was in May & April, respectively. The overall Daily trend has changed from Down to Up.

48/
Over the next few days you'll see price trade within the 'Wedge' highlighted in orange. You will see a breakout.
The only bad news is that price is near Resistance and the RSI is at overbought levels. After 8 consecutive green days you should expect a little retracement.
Over the next few days you'll see price trade within the 'Wedge' highlighted in orange. You will see a breakout.
The only bad news is that price is near Resistance and the RSI is at overbought levels. After 8 consecutive green days you should expect a little retracement.

49/
As mentioned in 46/ you saw the RSI reach very high levels. It even reached the 90's as mentioned before. These levels are extremely overbought and you will never see an RSI of 99 or 100. When assets are overbought retracements should be expected.
As mentioned in 46/ you saw the RSI reach very high levels. It even reached the 90's as mentioned before. These levels are extremely overbought and you will never see an RSI of 99 or 100. When assets are overbought retracements should be expected.

50/
As mentioned in 48/ you saw price breakout of the Wedge and upward towards the 100 Day MA as mentioned before. However, the Bears have a strong ceiling and you saw 3 attempts to continue the upward price action but in the end, Bears prevailed. For now.
As mentioned in 48/ you saw price breakout of the Wedge and upward towards the 100 Day MA as mentioned before. However, the Bears have a strong ceiling and you saw 3 attempts to continue the upward price action but in the end, Bears prevailed. For now.

51/
When the price is rising you are to draw your diagonal trend lines by connecting the Low's (low price points) & on price decline, you are to connect the High's (high price points) to guage the breakout lines. Once broken, a reversal is likely to happen.
#Bitcoin
When the price is rising you are to draw your diagonal trend lines by connecting the Low's (low price points) & on price decline, you are to connect the High's (high price points) to guage the breakout lines. Once broken, a reversal is likely to happen.
#Bitcoin

52/
As mentioned in 36/ price action always trades in between the bands, no matter the breakout.
What's next?
•You could see a retracement to the MID Bollinger Bands before a continued upward price action.
•Look for a reversal as #BTC becomes oversold on the RSI.
As mentioned in 36/ price action always trades in between the bands, no matter the breakout.
What's next?
•You could see a retracement to the MID Bollinger Bands before a continued upward price action.
•Look for a reversal as #BTC becomes oversold on the RSI.

53/
As mentioned in 52/ you saw the price retrace to near the MID Bollinger Bands before continuing the upward price action as #Bitcoin was getting closer to being oversold (48) on the Daily. Price is still trading in between the Support & Resistance levels mentioned in 1/.
As mentioned in 52/ you saw the price retrace to near the MID Bollinger Bands before continuing the upward price action as #Bitcoin was getting closer to being oversold (48) on the Daily. Price is still trading in between the Support & Resistance levels mentioned in 1/.

54/
The good news is that the MACD is above the 0 line. The centerline is what separates the trends on any given timeframe.
Bad news is that we are (once again) at Resistance and the RSI has become more overbought than oversold.
The good news is that the MACD is above the 0 line. The centerline is what separates the trends on any given timeframe.
Bad news is that we are (once again) at Resistance and the RSI has become more overbought than oversold.

55/
Although you saw a price close above $41K on July 29th -30th keep in mind that this is still heavy Resistance and this means that Buyers aren't willing to pay more than ~$41K at this particular time. Eventually $41K will be the price that the Sellers will not sell below.😉
Although you saw a price close above $41K on July 29th -30th keep in mind that this is still heavy Resistance and this means that Buyers aren't willing to pay more than ~$41K at this particular time. Eventually $41K will be the price that the Sellers will not sell below.😉

56/
Good news outweighed the bad news and now you have Sellers not wanting to sell below $41K. This means that resistance at 41K has turned back into support. $41K has been a level of interest since price reached it in January. It first became support in February.
Good news outweighed the bad news and now you have Sellers not wanting to sell below $41K. This means that resistance at 41K has turned back into support. $41K has been a level of interest since price reached it in January. It first became support in February.
57/
#Bitcoin has reached its next Resistance levels as mentioned in 1/ which is $45K-$50K. These are two Resistance levels dating back to February. The Bulls will need to breakout and *close above $45K for a continued price surge.
#Bitcoin has reached its next Resistance levels as mentioned in 1/ which is $45K-$50K. These are two Resistance levels dating back to February. The Bulls will need to breakout and *close above $45K for a continued price surge.

58/
What to watch:
•Price trade within the trend channel.
•200 Day MA act as Support or Resistance.
•Golden Cross (50 Day MA cross the 100 Day MA) over the next week or so.
•Histogram strength
•MACD lines get closer to one another.
•RSI overbought & oversold conditions.
What to watch:
•Price trade within the trend channel.
•200 Day MA act as Support or Resistance.
•Golden Cross (50 Day MA cross the 100 Day MA) over the next week or so.
•Histogram strength
•MACD lines get closer to one another.
•RSI overbought & oversold conditions.

59/
As mentioned in 58/ hopefully you been watching as you saw:
•Price trade within the Trend Channel.
•The 200 day MA act as Support/Resistance.
•MACD lines get closer to one another.
Soon both the 50 Day & 100 Day MA will cross.
The RSI & Histogram is still one to watch.
As mentioned in 58/ hopefully you been watching as you saw:
•Price trade within the Trend Channel.
•The 200 day MA act as Support/Resistance.
•MACD lines get closer to one another.
Soon both the 50 Day & 100 Day MA will cross.
The RSI & Histogram is still one to watch.

60/
The 'Golden Cross ' 50 Day MA crossing the 100 Day MA is considered to be a bullish sentiment as short-term price action is bearish compared to the longer term price action. A Golden Cross implies a potential shift in the direction of the overall trend.
The 'Golden Cross ' 50 Day MA crossing the 100 Day MA is considered to be a bullish sentiment as short-term price action is bearish compared to the longer term price action. A Golden Cross implies a potential shift in the direction of the overall trend.

61/
The 200 Day MA however has been acting as Support & Resistance over the past week. There is also the pre-existing Resistance between $45-$50K as mentioned in 1/.
In a few weeks you'll see another 'Golden Cross' as the 50 Day MA crosses the 200 Day MA.
The 200 Day MA however has been acting as Support & Resistance over the past week. There is also the pre-existing Resistance between $45-$50K as mentioned in 1/.
In a few weeks you'll see another 'Golden Cross' as the 50 Day MA crosses the 200 Day MA.

62/
The RSI has fluctuated from near Overbought to not so Oversold. This is aligned with the Bullish sentiment across the entire Market.
You could see a temporary retracement to Support or near as the price moves from Overbought to Oversold and then back to Overbought.
The RSI has fluctuated from near Overbought to not so Oversold. This is aligned with the Bullish sentiment across the entire Market.
You could see a temporary retracement to Support or near as the price moves from Overbought to Oversold and then back to Overbought.

63/
You also saw [as mentioned in 59/] the MACD get closer & cross one another but since the overall Daily Trend is positive you didn't see a huge retracement.
Over the next few days be on the look out for another cross but not before a 'Fakeout.'
You also saw [as mentioned in 59/] the MACD get closer & cross one another but since the overall Daily Trend is positive you didn't see a huge retracement.
Over the next few days be on the look out for another cross but not before a 'Fakeout.'

64/
The Golden Cross took #Bitcoin from $44K to $50K in just a few days. Moving Averages moving up means that Resistance turns into Support and the next price average or *Moving Average* is tested. In this case it was the $45K-$50K range mentioned in 61/.
The Golden Cross took #Bitcoin from $44K to $50K in just a few days. Moving Averages moving up means that Resistance turns into Support and the next price average or *Moving Average* is tested. In this case it was the $45K-$50K range mentioned in 61/.

65/
Also as mentioned in 61/ you are still seeing the 200 Day MA act as Support as it fluctuates from Resistance just 8 days ago. The 200 Day MA is the main Indicator to watch. Price will either bounce off of this level or breakthrough. Next Golden Cross (50 Day/200 Day) soon.
Also as mentioned in 61/ you are still seeing the 200 Day MA act as Support as it fluctuates from Resistance just 8 days ago. The 200 Day MA is the main Indicator to watch. Price will either bounce off of this level or breakthrough. Next Golden Cross (50 Day/200 Day) soon.

66/
As mentioned in 62/ you saw the RSI go from Overbought to Oversold and soon to see Overbought again. The highest over the last week is 74 age 72. The RSI is now near Oversold at 44. It could reach even lower levels before going back to Overbought.
As mentioned in 62/ you saw the RSI go from Overbought to Oversold and soon to see Overbought again. The highest over the last week is 74 age 72. The RSI is now near Oversold at 44. It could reach even lower levels before going back to Overbought.

67/
As mentioned in 63/ the 'Fakeout' is something to consider when looking at the MACD. When the MACD/Signal line cross over one another, (depending on the overall trend) it could misguide a trader that is looking at the MACD crosses alone. That's why it's called a 'Fakeout.'
As mentioned in 63/ the 'Fakeout' is something to consider when looking at the MACD. When the MACD/Signal line cross over one another, (depending on the overall trend) it could misguide a trader that is looking at the MACD crosses alone. That's why it's called a 'Fakeout.'

68/
The Bulls tried 7 times to break through the top of resistance level at $50K and failed. Usually you see just a few attempts. Price has also broken through the diagonal trendline but hopefully the 200 Day will act as support. If not, a retest of previous support is in order.
The Bulls tried 7 times to break through the top of resistance level at $50K and failed. Usually you see just a few attempts. Price has also broken through the diagonal trendline but hopefully the 200 Day will act as support. If not, a retest of previous support is in order.

69/
As mentioned in 65/ you saw a continued price support at the 200 Day MA. Over the past week you saw the price bounce off of this level with no breakouts below. This puts the 200 Day MA (~$46K) as strong Support. It is still the main Indicator to watch.
As mentioned in 65/ you saw a continued price support at the 200 Day MA. Over the past week you saw the price bounce off of this level with no breakouts below. This puts the 200 Day MA (~$46K) as strong Support. It is still the main Indicator to watch.

70/
As mentioned in 68/ you saw the 200 Day MA act as Support. The Bears tried to turn Support back into Resistance about 5 times. The Bulls obviously prevailed and looking to turn the next Resistance into Support. Price will need to close above $52K for confirmation.
As mentioned in 68/ you saw the 200 Day MA act as Support. The Bears tried to turn Support back into Resistance about 5 times. The Bulls obviously prevailed and looking to turn the next Resistance into Support. Price will need to close above $52K for confirmation.

71/
Over the next week or so you will see yet another Golden Cross as the 50 Day MA crosses the 200 Day MA. This is Bullish as average prices are moving/ going up. When the average price goes up, so does the ceiling price.
Over the next week or so you will see yet another Golden Cross as the 50 Day MA crosses the 200 Day MA. This is Bullish as average prices are moving/ going up. When the average price goes up, so does the ceiling price.

72/
What to watch:
•Overbought conditions turn into oversold.
•MACD cross & 'Fakeout.'
•MACD/Signal line move closer to 0 line.
•Price trade between Support & Resistance.
•Volume as El Salvador makes #Bitcoin legal tender over the next few days and give its citizens coins.
What to watch:
•Overbought conditions turn into oversold.
•MACD cross & 'Fakeout.'
•MACD/Signal line move closer to 0 line.
•Price trade between Support & Resistance.
•Volume as El Salvador makes #Bitcoin legal tender over the next few days and give its citizens coins.

73/
As mentioned in 69/ you continue to see the 200 day be the main attraction in the Technical World. It is truly acting as support & resistance. Although the Bears have been putting up a good fight the Bulls are firm on this support level. Again, the 200Day MA is one to watch.
As mentioned in 69/ you continue to see the 200 day be the main attraction in the Technical World. It is truly acting as support & resistance. Although the Bears have been putting up a good fight the Bulls are firm on this support level. Again, the 200Day MA is one to watch.

74/
Although you got confirmation at heavy Resistance at ~$52K as mentioned in 70/ you also had an overbought RSI reading and a double MACD cross on an uptrend. That ultimately will lead to retracements. Eventually $52K will act as strong Support as the other indicators line up.
Although you got confirmation at heavy Resistance at ~$52K as mentioned in 70/ you also had an overbought RSI reading and a double MACD cross on an uptrend. That ultimately will lead to retracements. Eventually $52K will act as strong Support as the other indicators line up.

75/
It's been about a 'week or so' or a week and 4 days to be exact but you saw over the past 24 hours the 'Golden Cross' as mentioned in 71/.
As you can see, this is a bullish signal to all traders around the World. Ceiling prices will rise all the time. There is no cap. #BTC
It's been about a 'week or so' or a week and 4 days to be exact but you saw over the past 24 hours the 'Golden Cross' as mentioned in 71/.
As you can see, this is a bullish signal to all traders around the World. Ceiling prices will rise all the time. There is no cap. #BTC

76/
Things we were watching in 72/
✅Overbought conditions turn into Oversold
✅MACD cross & Fakeout
✅MACD & Signal line move closer to 0 line
✅Price trade between Support/ Resistance & 200DayMA
✅Volume as El Salvador makes #BitcoinDay legal tender & give its citizens coins.
Things we were watching in 72/
✅Overbought conditions turn into Oversold
✅MACD cross & Fakeout
✅MACD & Signal line move closer to 0 line
✅Price trade between Support/ Resistance & 200DayMA
✅Volume as El Salvador makes #BitcoinDay legal tender & give its citizens coins.

77/
What's next? 🤔📈📉
The daily candle will likely end with a 'Doji' as traders & investors take profits & buy the dip [selling/ buying]. Also the RSI is at the mid point of Overbought & Oversold. You could also see a bit of a sideways trend between $45K and $52K.
Or..
What's next? 🤔📈📉
The daily candle will likely end with a 'Doji' as traders & investors take profits & buy the dip [selling/ buying]. Also the RSI is at the mid point of Overbought & Oversold. You could also see a bit of a sideways trend between $45K and $52K.
Or..

78/
If the MACD/Signal line cross the 0 line you can expect a retest of the previous sideways price action between the Ol' $41K-$45K range. This is the less likely action as the 50DayMA has just crossed back over the 200DayMA but anything can happen as sellers sell & buyers buy.
If the MACD/Signal line cross the 0 line you can expect a retest of the previous sideways price action between the Ol' $41K-$45K range. This is the less likely action as the 50DayMA has just crossed back over the 200DayMA but anything can happen as sellers sell & buyers buy.

79/
As mentioned in 77/ you saw a bit of a sideways price action as the Golden Cross took place and left Bull & Bear traders indecisive. You didn't however see a Doji as I expected, instead a normal Bullish candlestick. Also the RSI went from a mid point to oversold in the 20's.
As mentioned in 77/ you saw a bit of a sideways price action as the Golden Cross took place and left Bull & Bear traders indecisive. You didn't however see a Doji as I expected, instead a normal Bullish candlestick. Also the RSI went from a mid point to oversold in the 20's.

80/
When looking at TA you can never rule anything out as not just a few things you think will happen but perhaps all things in due time. TA is not a prediction tool but a guide tool. The things mentioned in 78/ was a possibility; it has now come to reality. Anything can happen.
When looking at TA you can never rule anything out as not just a few things you think will happen but perhaps all things in due time. TA is not a prediction tool but a guide tool. The things mentioned in 78/ was a possibility; it has now come to reality. Anything can happen.

81/
The Trend has changed. Now what!?
Expect:
•The 100 Day MA to act as Support and the 50 & 200 to act as Resistance (which is near the existing $41K-45K price trading range).
•MACD cross back over the 0 line to return the Daily trend back to an Uptrend.
#Bitcoin
The Trend has changed. Now what!?
Expect:
•The 100 Day MA to act as Support and the 50 & 200 to act as Resistance (which is near the existing $41K-45K price trading range).
•MACD cross back over the 0 line to return the Daily trend back to an Uptrend.
#Bitcoin

82/
Also, if the MACD stays under the 0 line and the RSI weakens you could see in this Daily downtrend:
•The Support of $41K turn back into Resistance.
•A retest of the previous $34K-$37K support.
•Volume decline as majority
(#HODL'ers) will hold and newcomers buy the dip.
Also, if the MACD stays under the 0 line and the RSI weakens you could see in this Daily downtrend:
•The Support of $41K turn back into Resistance.
•A retest of the previous $34K-$37K support.
•Volume decline as majority
(#HODL'ers) will hold and newcomers buy the dip.

83/
As mentioned in 81/ the trend has changed and you saw/seeing the 100 Day MA to act as Support & the 50 & 200 act as Resistance(which is the existing $41K-45K trading range)
The MACD hasn't crossed back over the 0 line to return the daily trend back to an UPtrend but it will.
As mentioned in 81/ the trend has changed and you saw/seeing the 100 Day MA to act as Support & the 50 & 200 act as Resistance(which is the existing $41K-45K trading range)
The MACD hasn't crossed back over the 0 line to return the daily trend back to an UPtrend but it will.

84/
What could happen, happened as mentioned in 82/. Today you are seeing a fight between Bulls & Bears to try and turn $41K Support back into Resistance as the RSI weakens & the MACD stay under the 0 line. Today is a critical day in traders decision making. To long or to short?
What could happen, happened as mentioned in 82/. Today you are seeing a fight between Bulls & Bears to try and turn $41K Support back into Resistance as the RSI weakens & the MACD stay under the 0 line. Today is a critical day in traders decision making. To long or to short?

85/
Also as mentioned in 82/ you saw (over the past 6 days) Volume decline with only 1 spike due to investors buying the dip as #Bitcoin opened as high as $45K and dipped down to $40K.
Good news: we haven't seen a retest of $34K-$37K.
Also as mentioned in 82/ you saw (over the past 6 days) Volume decline with only 1 spike due to investors buying the dip as #Bitcoin opened as high as $45K and dipped down to $40K.
Good news: we haven't seen a retest of $34K-$37K.

86/
Now what?
There are a few scenarios.
1. As traders see the Oversold RSI rating, they will buy and increase price [the MACD lines will make their way back to the 0 line as a result]
2. An unexpected 'Death Cross' as the 50 Day MA potentially crosses the 200 Day MA again.
Now what?
There are a few scenarios.
1. As traders see the Oversold RSI rating, they will buy and increase price [the MACD lines will make their way back to the 0 line as a result]
2. An unexpected 'Death Cross' as the 50 Day MA potentially crosses the 200 Day MA again.

87/
3. A continued sideways trend between $41K-$45K Support & Resistance.
4. A retest of the $34K-$37K support range.
*Traders move the Market and it will always be hard trying to interpret what the Bulls & Bears will do next. This is why there is no such thing as a TA expert.
3. A continued sideways trend between $41K-$45K Support & Resistance.
4. A retest of the $34K-$37K support range.
*Traders move the Market and it will always be hard trying to interpret what the Bulls & Bears will do next. This is why there is no such thing as a TA expert.

88/
As mentioned in 86/ & 87/ there were a few scenarios as to what will happen next with #Bitcoin
The 1st scenario has played out. Traders saw the *Oversold RSI rating and started buying and going 'Long.' The MACD lines have made their way back to the 0 line as a result.
As mentioned in 86/ & 87/ there were a few scenarios as to what will happen next with #Bitcoin
The 1st scenario has played out. Traders saw the *Oversold RSI rating and started buying and going 'Long.' The MACD lines have made their way back to the 0 line as a result.

89/
Resistance (which is also the 50 Day MA) has become Support, again. Resistance will eventually turn into Support but Support will not always turn back into Resistance. The next Resistance, which was once Support is at the $51K range.
#Bitcoin
Resistance (which is also the 50 Day MA) has become Support, again. Resistance will eventually turn into Support but Support will not always turn back into Resistance. The next Resistance, which was once Support is at the $51K range.
#Bitcoin

90/
So now what?
•Well, scenarios 2-4 mentioned in 86/ & 87/ are not completely off the table.
•As the RSI went from Oversold to now almost Overbought in the last few days, traders are yet at another crossroad. You could actually see the RSI reach 80+ on this Bullrun.
So now what?
•Well, scenarios 2-4 mentioned in 86/ & 87/ are not completely off the table.
•As the RSI went from Oversold to now almost Overbought in the last few days, traders are yet at another crossroad. You could actually see the RSI reach 80+ on this Bullrun.
91/
•If both lines of the MACD cross over the 0 line you could see a retest of Resistance but you could also see a 'Fakeout' if both lines do not cross.
•As mentioned before the 100 Day MA will eventually cross over the 200 Day MA.
*All signals are Bullish at this moment.
•If both lines of the MACD cross over the 0 line you could see a retest of Resistance but you could also see a 'Fakeout' if both lines do not cross.
•As mentioned before the 100 Day MA will eventually cross over the 200 Day MA.
*All signals are Bullish at this moment.

92/ [Revision]
As mentioned in 90/ the RSI is now at 80 but it could go as high as 90 but never above 100. The Bulls are destroying the Bears!!
Now that we are at heavy Resistance of $52K the real fight begins. As always, to long or to short? Traders have a hard job. Lol.
As mentioned in 90/ the RSI is now at 80 but it could go as high as 90 but never above 100. The Bulls are destroying the Bears!!
Now that we are at heavy Resistance of $52K the real fight begins. As always, to long or to short? Traders have a hard job. Lol.
93/
As mentioned in 91/ you saw the MACD cross over the 0 line and you saw a retest of all Resistance levels from $52K to near the previous ATH. As mentioned, all signals were Bullish. Soon the 100 Day MA will cross over the 200 Day MA.
#Bitcoin
As mentioned in 91/ you saw the MACD cross over the 0 line and you saw a retest of all Resistance levels from $52K to near the previous ATH. As mentioned, all signals were Bullish. Soon the 100 Day MA will cross over the 200 Day MA.
#Bitcoin

94/
As mentioned in the Revision in 92/ you saw the RSI reach and surpass a 80 reading going as high as 87. Those who shorted at $52K were liquidated & those who went long were rewarded. It's always 50/50 from entry when trading futures or options. The Bulls destroyed the Bears.
As mentioned in the Revision in 92/ you saw the RSI reach and surpass a 80 reading going as high as 87. Those who shorted at $52K were liquidated & those who went long were rewarded. It's always 50/50 from entry when trading futures or options. The Bulls destroyed the Bears.

95/
Now what!?
It's never easy but you have to go with the flow of the Market.
You could see:
•A retracement to Support at $52K
•The MACD cross
•The RSI reach oversold levels as it has been overbought for many days now.
•New ATH as the overall Daily trend is UP.
*FA > TA
Now what!?
It's never easy but you have to go with the flow of the Market.
You could see:
•A retracement to Support at $52K
•The MACD cross
•The RSI reach oversold levels as it has been overbought for many days now.
•New ATH as the overall Daily trend is UP.
*FA > TA

96/
As mentioned in 93/ & earlier posts all signals were Bullish and you saw the 100 Day MA cross over the 200 Day MA. This was a very significant sentiment in TA and as you saw over the past week & a half the price climb. Traders take TA trading signals very seriously.
#Bitcoin
As mentioned in 93/ & earlier posts all signals were Bullish and you saw the 100 Day MA cross over the 200 Day MA. This was a very significant sentiment in TA and as you saw over the past week & a half the price climb. Traders take TA trading signals very seriously.
#Bitcoin

97/
As mentioned in 95/ you saw:
✅New All-Time High (ATH) as the overall trend is up. The MACD determines the trend on any timeframe. The longer the timeframe the better the signal.
✅RSI reach oversold levels going as low as 37.
✅The MACD cross.
As mentioned in 95/ you saw:
✅New All-Time High (ATH) as the overall trend is up. The MACD determines the trend on any timeframe. The longer the timeframe the better the signal.
✅RSI reach oversold levels going as low as 37.
✅The MACD cross.
98/
Also as mentioned in 95/ I stated that you could see retracements to $52K. This hasn't happened as of yet but eventually it will. Retracements are necessary to shake out weak hands and trigger stop losses & longs(Futures).
Also as mentioned in 95/ I stated that you could see retracements to $52K. This hasn't happened as of yet but eventually it will. Retracements are necessary to shake out weak hands and trigger stop losses & longs(Futures).

99/
What an interesting 3 weeks! $69K ATH
#Bitcoin reached new ATH's after another. Now what?
There are always a few scenarios: Over the next weeks:
•As mentioned in 98/ you could still see retracements to $52K
Traders move the Market and manipulation is easier with low volume.
What an interesting 3 weeks! $69K ATH
#Bitcoin reached new ATH's after another. Now what?
There are always a few scenarios: Over the next weeks:
•As mentioned in 98/ you could still see retracements to $52K
Traders move the Market and manipulation is easier with low volume.

100/
Also over the next few weeks you could see:
•$60K act as Resistance after being Support for the past 2 weeks.
•The 50 Day MA & 100 Day MA act as Support & Resistance.
•MACD 'Fakeout' cross followed by a cross below the 0 line.
•The Daily trend change.
Also over the next few weeks you could see:
•$60K act as Resistance after being Support for the past 2 weeks.
•The 50 Day MA & 100 Day MA act as Support & Resistance.
•MACD 'Fakeout' cross followed by a cross below the 0 line.
•The Daily trend change.

101/
As mentioned in 100/ you are seeing:
✅$60K act as Resistance.
✅The 50 & 100 Day MA acting as Support & Resistance.
✅MACD 'Fakeout' followed by a cross below the 0 line.
✅The Daily trend change.
#Bitcoin
As mentioned in 100/ you are seeing:
✅$60K act as Resistance.
✅The 50 & 100 Day MA acting as Support & Resistance.
✅MACD 'Fakeout' followed by a cross below the 0 line.
✅The Daily trend change.
#Bitcoin

102/
Over the next days or so the most important indicator to watch is the 100 Day MA. Expect major volatility. This is major support and the fight between the Bulls & Bears will get tougher. Expect a bounce off and a possible breakthrough. The Market Makers are smart.
Over the next days or so the most important indicator to watch is the 100 Day MA. Expect major volatility. This is major support and the fight between the Bulls & Bears will get tougher. Expect a bounce off and a possible breakthrough. The Market Makers are smart.

103/
As mentioned in 95/,98/,99/ you are seeing that $52K range breached. This is major support.
Also as mentioned in 100/ you saw over the past week a continued:
•$60K act as Resistance and the 50 Day MA & 100 Day MA act as Support & Resistance respectively.
#Bitcoin
As mentioned in 95/,98/,99/ you are seeing that $52K range breached. This is major support.
Also as mentioned in 100/ you saw over the past week a continued:
•$60K act as Resistance and the 50 Day MA & 100 Day MA act as Support & Resistance respectively.
#Bitcoin

104/
As mentioned in 102/ you saw and are seeing major volatility as the 100 Day MA is breached. The Bears are trying to turn this Support level into Resistance. Also as mentioned, you saw the price bounce off of the 100 Day MA a few times before today's breakthrough.
As mentioned in 102/ you saw and are seeing major volatility as the 100 Day MA is breached. The Bears are trying to turn this Support level into Resistance. Also as mentioned, you saw the price bounce off of the 100 Day MA a few times before today's breakthrough.
105/
Now what?
A few scenarios:
•Now that the price is in oversold territory in respects to the RSI, you could see a reversal to at least a score of 40-50's.
•You could see a retest of previous Support at the 200 Day MA if the Bulls turn the 100 Day MA back into Resistance.
Now what?
A few scenarios:
•Now that the price is in oversold territory in respects to the RSI, you could see a reversal to at least a score of 40-50's.
•You could see a retest of previous Support at the 200 Day MA if the Bulls turn the 100 Day MA back into Resistance.

106/
As mentioned in 104/ the Bears have accomplished turning the 100 Day MA Support level into Resistance. The past week or so has been very volatile due to many circumstances. One being Options contracts, the other, simply a trend change. #Bitcoin
As mentioned in 104/ the Bears have accomplished turning the 100 Day MA Support level into Resistance. The past week or so has been very volatile due to many circumstances. One being Options contracts, the other, simply a trend change. #Bitcoin

107/
As mentioned in 105/ you saw the price action reach the Oversold RSI reading on many levels before a reversal to the 40's. The Bulls couldn't reach the 50's yet but eventually they will.
Also as mentioned you saw and are seeing a retest of the 200 Day MA support.
As mentioned in 105/ you saw the price action reach the Oversold RSI reading on many levels before a reversal to the 40's. The Bulls couldn't reach the 50's yet but eventually they will.
Also as mentioned you saw and are seeing a retest of the 200 Day MA support.

108/
Now what!?
A few scenarios over the next few days to a week.
•You could see another reversal as the price action is in Oversold territory.
•You could see a retest of previous Support at $42K range as mentioned in several earlier Tweets in this thread.
Now what!?
A few scenarios over the next few days to a week.
•You could see another reversal as the price action is in Oversold territory.
•You could see a retest of previous Support at $42K range as mentioned in several earlier Tweets in this thread.

109/
•Another scenario includes a 'Death Cross' (by definition) as the 50 day MA looks to cross the 100 Day MA. If the Bulls cannot regain control this is likely to occur.
•Ultimately the MACD & Signal line will cross one another after a few 'Fakeouts' & the trend will change.
•Another scenario includes a 'Death Cross' (by definition) as the 50 day MA looks to cross the 100 Day MA. If the Bulls cannot regain control this is likely to occur.
•Ultimately the MACD & Signal line will cross one another after a few 'Fakeouts' & the trend will change.

110/
As mentioned in 108/ there were a few scenarios as to what will happen next.
✅You could see another reversal [to Overbought] as the price action is in Oversold territory.
❌You could see another retest of previous Support at $42K range. (This is still a possibility)
As mentioned in 108/ there were a few scenarios as to what will happen next.
✅You could see another reversal [to Overbought] as the price action is in Oversold territory.
❌You could see another retest of previous Support at $42K range. (This is still a possibility)

111/
In entry 109/:
✅.. a 'Death Cross' (by definition) as the 50 day Moving Average (MA) crossed the 100 Day MA.
✅MACD & Signal line crossed one another after a few 'Fakeouts.'
The daily trend will still ultimately change.
In entry 109/:
✅.. a 'Death Cross' (by definition) as the 50 day Moving Average (MA) crossed the 100 Day MA.
✅MACD & Signal line crossed one another after a few 'Fakeouts.'
The daily trend will still ultimately change.

112/
What to watch:
Continue seeing this sideways trend until there is a breakout and *close* below $45K (support) or above $52K (resistance). This sideways price action has been going on for almost a month and until there is a breakout expect price action in between the two.
What to watch:
Continue seeing this sideways trend until there is a breakout and *close* below $45K (support) or above $52K (resistance). This sideways price action has been going on for almost a month and until there is a breakout expect price action in between the two.

113/
I can only guess what the indicators will look like over the next week or so. If I had to guess you'd see a MACD 'Fakeout' followed by a trend change; but not before a retest of the 200 Day Moving Average and an Oversold reading.
Here's what it could look like:✏
I can only guess what the indicators will look like over the next week or so. If I had to guess you'd see a MACD 'Fakeout' followed by a trend change; but not before a retest of the 200 Day Moving Average and an Oversold reading.
Here's what it could look like:✏


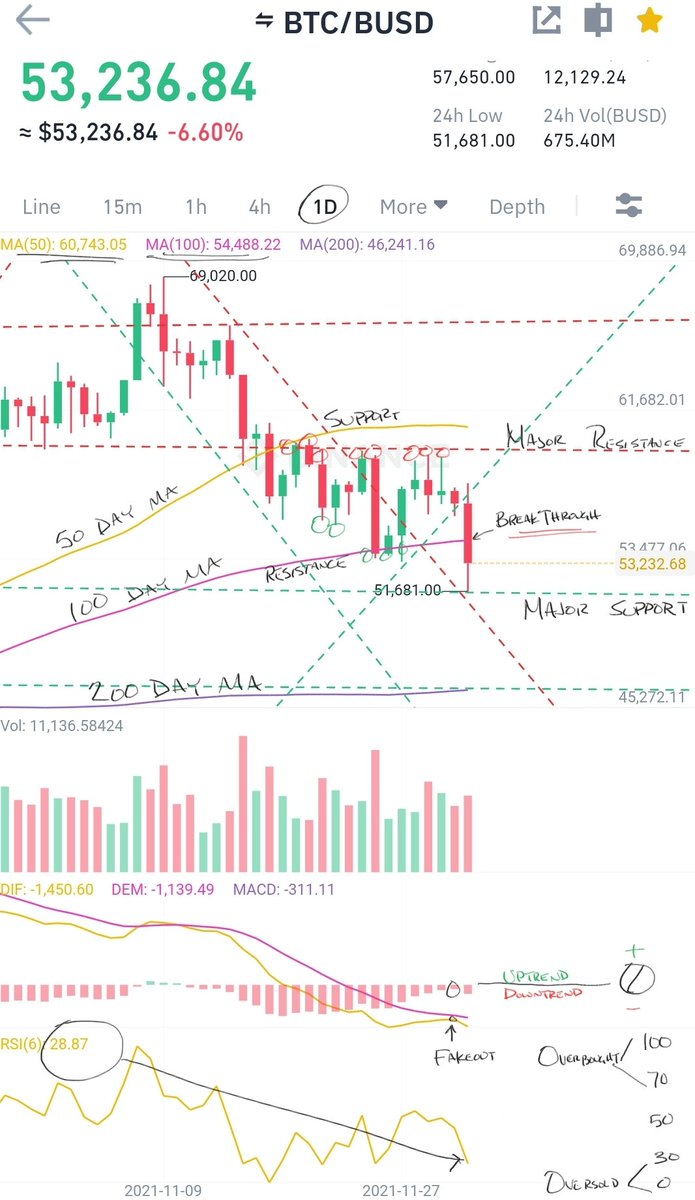
114/
As mentioned in 110/ $42K price range was still a possibility and today the Bears managed to reach $42.5K, which is the next support range. The overall DAILY trend is still down so while we can be optimistic, we should never trade against the trend no matter the timeframe.
As mentioned in 110/ $42K price range was still a possibility and today the Bears managed to reach $42.5K, which is the next support range. The overall DAILY trend is still down so while we can be optimistic, we should never trade against the trend no matter the timeframe.

115/
As mentioned in 112/ we had things to watch for.
This is where we stand:
Since then we continued to see a sideways price action until today's Breakout below $45K. This breakout is confirmation of a new price range. Support at $45K is now looking to turn into Resistance.
As mentioned in 112/ we had things to watch for.
This is where we stand:
Since then we continued to see a sideways price action until today's Breakout below $45K. This breakout is confirmation of a new price range. Support at $45K is now looking to turn into Resistance.

116/
The drawings projection was off in 113/.. lol. However, regarding the context you did and didn't see:
✅MACD 'Fakeout.'
✅Retest of 200 Day Moving Average
✅Oversold RSI
❌No daily trend change. (yet)
#Bitcoin
The drawings projection was off in 113/.. lol. However, regarding the context you did and didn't see:
✅MACD 'Fakeout.'
✅Retest of 200 Day Moving Average
✅Oversold RSI
❌No daily trend change. (yet)
#Bitcoin

117/
Now what!?
Following the Death Cross of the 50 day Moving Average (MA) crossing the 100 day MA, you could see another Death Cross (by definition), as the 50 day MA looks to cross the 200 day MA. This could suppress prices even more as trader's sentiment will change.
Now what!?
Following the Death Cross of the 50 day Moving Average (MA) crossing the 100 day MA, you could see another Death Cross (by definition), as the 50 day MA looks to cross the 200 day MA. This could suppress prices even more as trader's sentiment will change.
118/
Now what pt.2
As the price of #Bitcoin dips into Oversold RSI rating, you will likely see a spike (reversal) to near Overbought ratings.
You could also see yet another sideways price action over the next week or so in between $42K & $45K before yet another breakout.
Now what pt.2
As the price of #Bitcoin dips into Oversold RSI rating, you will likely see a spike (reversal) to near Overbought ratings.
You could also see yet another sideways price action over the next week or so in between $42K & $45K before yet another breakout.

119/
Quick update:
As mentioned in 117/ we saw yet another 'Death Cross' with the 50 day MA crossing the 200 day MA. Prices dipped as low as $39K in anticipation. Trader's sentiment is still 50/50. This is exactly what the Market Makers need to move prices to the next level.
Quick update:
As mentioned in 117/ we saw yet another 'Death Cross' with the 50 day MA crossing the 200 day MA. Prices dipped as low as $39K in anticipation. Trader's sentiment is still 50/50. This is exactly what the Market Makers need to move prices to the next level.

120/
As mentioned in 118/ you saw the RSI reach oversold rating going as low as 15.45 before reversing to *near overbought* of 52.53.
•0-30 = oversold
•70-100 = overbought
Also as mentioned you are seeing price trade in between $42K & $45K.
#Bitcoin
As mentioned in 118/ you saw the RSI reach oversold rating going as low as 15.45 before reversing to *near overbought* of 52.53.
•0-30 = oversold
•70-100 = overbought
Also as mentioned you are seeing price trade in between $42K & $45K.
#Bitcoin

121/
Now what ext.:
Continue to see what is mentioned in 118 & 120 which is the sideways price action. There will soon be a breakout as the Market Makers will have to move forward.
Also the daily trend is still down so don't be surprised to see another dip before the reversal.
Now what ext.:
Continue to see what is mentioned in 118 & 120 which is the sideways price action. There will soon be a breakout as the Market Makers will have to move forward.
Also the daily trend is still down so don't be surprised to see another dip before the reversal.

122/
Post 'Death Cross' you are seeing the actual effects of it, which simply means that average price per #Bitcoin is changing. Market Markers were successful in the 50/50 sentiment as some called $38K bottom, others a reversal. Next levels were reached as mentioned in 119/.
Post 'Death Cross' you are seeing the actual effects of it, which simply means that average price per #Bitcoin is changing. Market Markers were successful in the 50/50 sentiment as some called $38K bottom, others a reversal. Next levels were reached as mentioned in 119/.
123/
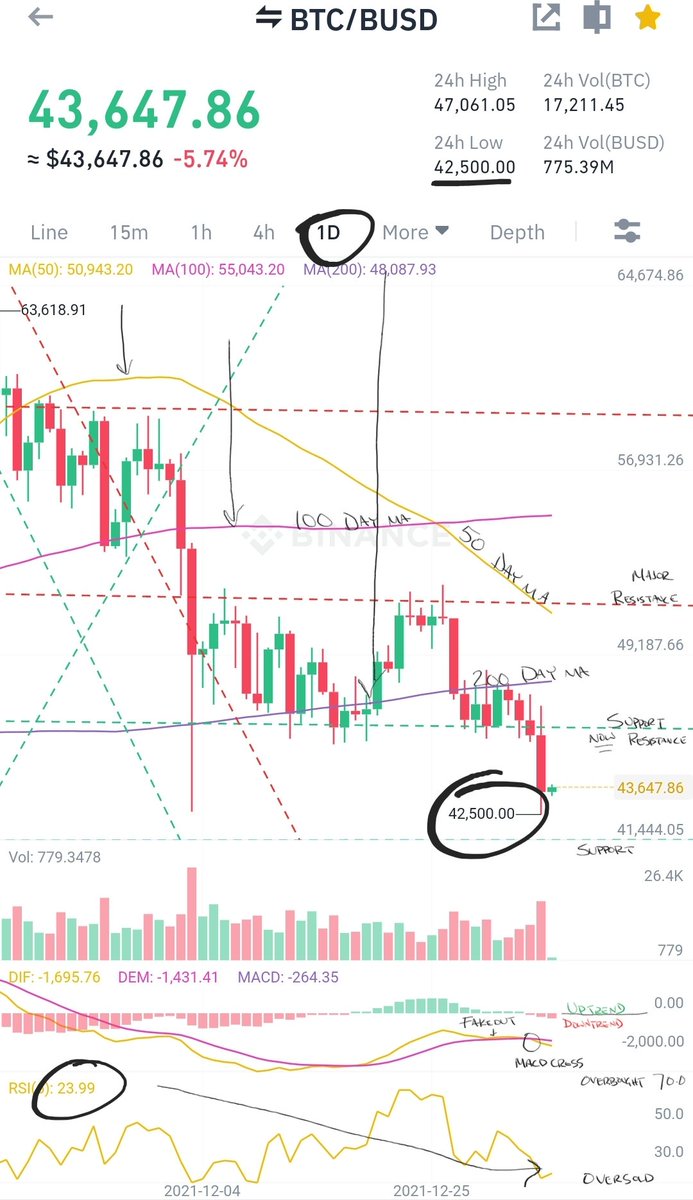
As mentioned in 121/ you continued to see a sideways price action between for 3 days before the 'breakout.' The Market Makers had to move forward with price action. No surprises there.
Also as mentioned in 121/ you saw a dip in price from $42K to $33K as the trend is down.
As mentioned in 121/ you continued to see a sideways price action between for 3 days before the 'breakout.' The Market Makers had to move forward with price action. No surprises there.
Also as mentioned in 121/ you saw a dip in price from $42K to $33K as the trend is down.

124/
Now what!?
Look forward to seeing a fight between the Bulls & Bears at $33K as this support level started as resistance back in January 2021. Within a month $33K turned into major support.
If the Bears win expect a retest of support at $28K. If the Bulls win, back to $42K.
Now what!?
Look forward to seeing a fight between the Bulls & Bears at $33K as this support level started as resistance back in January 2021. Within a month $33K turned into major support.
If the Bears win expect a retest of support at $28K. If the Bulls win, back to $42K.

125/
The Market Makers have one more trick up their sleeves. The Moving Averages (MA) have changed so much that it now appears that the 100 day MA is set to cross the 200 day MA for yet another Death Cross. With this, traders will be confused; to long or to short?? 🤔
The Market Makers have one more trick up their sleeves. The Moving Averages (MA) have changed so much that it now appears that the 100 day MA is set to cross the 200 day MA for yet another Death Cross. With this, traders will be confused; to long or to short?? 🤔

126/
As mentioned in 124/ you saw a fight at major support @ $33K. The Bulls put up a strong fight making higher lows following the days after Bears breached this major support range. Bulls reclaimed victory at $42K and now the same ol question remains; to long or to short? #BTC
As mentioned in 124/ you saw a fight at major support @ $33K. The Bulls put up a strong fight making higher lows following the days after Bears breached this major support range. Bulls reclaimed victory at $42K and now the same ol question remains; to long or to short? #BTC

127/
As mentioned in 125/ another Death Cross (by definition) is soon to happen as the Market Makers are trying to confuse traders. There will always be 'Fakeouts' so always be on the look out for them. Don't let price discovery confuse you; never trade against the trend.
As mentioned in 125/ another Death Cross (by definition) is soon to happen as the Market Makers are trying to confuse traders. There will always be 'Fakeouts' so always be on the look out for them. Don't let price discovery confuse you; never trade against the trend.

128/
Over the past 48 hours there has been indecisiveness within the Market. When prices are stagnant you start seeing Doji's, it's time to pay close attention.
Things to watch:
•RSI is Overbought
•The MACD/Signal Line still below the 0 line; but looks to cross over soon.
Over the past 48 hours there has been indecisiveness within the Market. When prices are stagnant you start seeing Doji's, it's time to pay close attention.
Things to watch:
•RSI is Overbought
•The MACD/Signal Line still below the 0 line; but looks to cross over soon.

129/
Things to watch cont.
•The Histogram bars
•The 100 day Moving Average (MA) & the 200 day MA.
•Current Trend lines
•$42K act as resistance before turning back into support.
•Retracements from overbought to near oversold.
Things to watch cont.
•The Histogram bars
•The 100 day Moving Average (MA) & the 200 day MA.
•Current Trend lines
•$42K act as resistance before turning back into support.
•Retracements from overbought to near oversold.

130/
As mentioned in 126/ the Bulls declared victory as they turned resistance of $42K back into support. Those who went long were profitable while those who shorted got liquidated. Once again, the same ol question remains; to long or to short at $42K? 🐂 or 🐻? #Bitcoin
As mentioned in 126/ the Bulls declared victory as they turned resistance of $42K back into support. Those who went long were profitable while those who shorted got liquidated. Once again, the same ol question remains; to long or to short at $42K? 🐂 or 🐻? #Bitcoin

131/
As mentioned in 127/ you saw another Death Cross (by definition) as the 100 Day Moving Average (MA) crossed below the 200 day MA. Unsurprisingly the price spiked before the cross and it's effects. Again, as mentioned over and over, be on the lookout for 'Fakeouts.'
As mentioned in 127/ you saw another Death Cross (by definition) as the 100 Day Moving Average (MA) crossed below the 200 day MA. Unsurprisingly the price spiked before the cross and it's effects. Again, as mentioned over and over, be on the lookout for 'Fakeouts.'

132/
As mentioned in 128/ you saw Doji's, which represents indecisiveness between Bulls & Bears. While the Bulls won the Doji war, reaching $45K, they are now back in the same situation just over a week later. The last few days have been nothing but Doji's. Who will win?
As mentioned in 128/ you saw Doji's, which represents indecisiveness between Bulls & Bears. While the Bulls won the Doji war, reaching $45K, they are now back in the same situation just over a week later. The last few days have been nothing but Doji's. Who will win?

133/
In 128/ & 129/ there were things to watch:
•The RSI was overbought at 73 but Bulls were able to reach 82 before running out of steam.
•The MACD/SL has crossed the 0 line as expected. The daily trend has technically changed.
•$42K is a major area of support & resistance.
In 128/ & 129/ there were things to watch:
•The RSI was overbought at 73 but Bulls were able to reach 82 before running out of steam.
•The MACD/SL has crossed the 0 line as expected. The daily trend has technically changed.
•$42K is a major area of support & resistance.

134/
Now what?
•Expect a Breakout over the next 24-48 hours after the current sideways price action.
•Expect several 'Fakeouts' as the MACD & Signal line are both above the 0 line (for now) which will confuse traders. Traders sentiment should be 50/50 at this moment. #Bitcoin
Now what?
•Expect a Breakout over the next 24-48 hours after the current sideways price action.
•Expect several 'Fakeouts' as the MACD & Signal line are both above the 0 line (for now) which will confuse traders. Traders sentiment should be 50/50 at this moment. #Bitcoin

135/
Now what? pt.2
•You could see the MACD & Signal line cross back over the 0 line back into downtrend territory. The Market Makers will always try to take advantage of traders.
•If major support at $42K holds then expect a retest of the next resistance level of $45K.
Now what? pt.2
•You could see the MACD & Signal line cross back over the 0 line back into downtrend territory. The Market Makers will always try to take advantage of traders.
•If major support at $42K holds then expect a retest of the next resistance level of $45K.

136/
Over the last week it has been a few breakouts, a few fakeouts, major support turned back into resistance, as well as more indecisiveness and the effects of a 'Death Cross.' We are at the same story from last month and July of 2021. To long or to short? #Bitcoin
Over the last week it has been a few breakouts, a few fakeouts, major support turned back into resistance, as well as more indecisiveness and the effects of a 'Death Cross.' We are at the same story from last month and July of 2021. To long or to short? #Bitcoin

137/
As mentioned in 134 & 135/ you saw, as expected:
✅️ a Breakout over the next 24-48 hours.
✅️ Several 'Fakeouts' as the MACD & Signal line were both above the 0 line (temporarily).
✅️ MACD & Signal line cross back below the 0 line.
✅️ A retest of Resistance at $45K.
As mentioned in 134 & 135/ you saw, as expected:
✅️ a Breakout over the next 24-48 hours.
✅️ Several 'Fakeouts' as the MACD & Signal line were both above the 0 line (temporarily).
✅️ MACD & Signal line cross back below the 0 line.
✅️ A retest of Resistance at $45K.

138/
Now what!?
•Expect more 'Fakeouts' as the MACD/Signal line is below the 0 line (again, for now) but soon to peak back into uptrend territory on the daily timeframe.
•Expect to see the price spike as the price of #Bitcoin is Oversold at the current 28.87 RSI rating.
Now what!?
•Expect more 'Fakeouts' as the MACD/Signal line is below the 0 line (again, for now) but soon to peak back into uptrend territory on the daily timeframe.
•Expect to see the price spike as the price of #Bitcoin is Oversold at the current 28.87 RSI rating.

139/
•Expect the 50 day Moving Average (MA) to cross above the 100 day MA over the next weeks or so. This will be the first 'Golden Cross.' It will take more than a month for the next Golden Cross to happen when the 100 day MA crosses back above the 200 day MA. #Bitcoin
•Expect the 50 day Moving Average (MA) to cross above the 100 day MA over the next weeks or so. This will be the first 'Golden Cross.' It will take more than a month for the next Golden Cross to happen when the 100 day MA crosses back above the 200 day MA. #Bitcoin

@threadreaderapp unroll
• • •
Missing some Tweet in this thread? You can try to
force a refresh